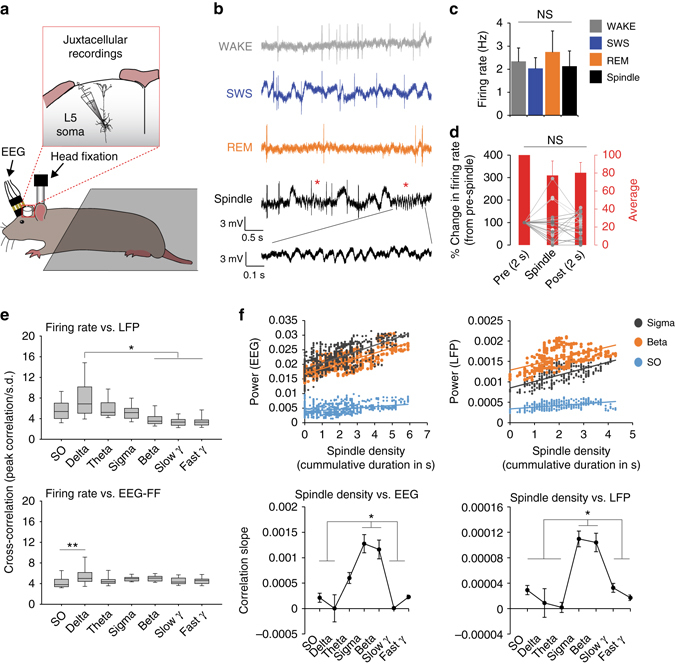
Fig. 7.

Relationship between EEG, LFP and spiking activity of L5 cell bodies. a Schematic of combined juxtacellular and EEG recordings in head-fixed rats. b Representative examples of local field potential (LFP) traces and firing pattern of L5 pyramidal neurons during WAKE, SWS, REM sleep and isolated spindles during SWS (red asterisks). c Mean (±s.e.m.) firing rate across behavioural states and spindle events (n = 23 cells/2 rats). d Peri-spindle change in firing rate (expressed as percentage of change from pre-spindle events) for each cell. Lines represent individual cells and red bars the average across all cells. e Average cross-correlation between firing rate and LFP/EEG frequency bands during SWS (expressed as the peak correlation within a ±5s window/s.d. of the cross-correlation; see Methods). Firing rate shows a stronger correlation with delta oscillations in the LFP (upper graph; H = 55.2, P < 0.001 Kruskal–Wallis one-way ANOVA on ranks; *P < 0.05, Dunn’s test). A two-way ANOVA revealed a significant effect of EEG and frequency on firing rate (factor “EEG”: F1, 224 = 12.49, factor “frequency”: F1, 224 = 4.69, P < 0.001 for both factors). Post hoc comparisons showed a stronger correlation between firing and delta oscillations only in the frontal EEG (lower graph; **P < 0.01, Holm–Sidak test; see Supplementary Fig. 11 for parietal EEG results). f Sigma–beta oscillations reflect spindle density. (Upper graphs) Representative scatter plots showing correlation between spindle density (cumulative spindle duration within 10 s windows, see Methods) and EEG/LFP power for sigma, beta and SO for one recording (data points represent individual 10 s windows). (Lower graphs) Mean (±s.e.m.) correlation slope for all frequency bands for EEG and LFP recordings (EEG: H = 49.9, LFP: H = 51.8, P < 0.001 for both, Kruskal–Wallis one-way ANOVA on ranks; *P < 0.05, Dunn’s test; n = 17, see Methods for number justification)
