
Fig. 2.
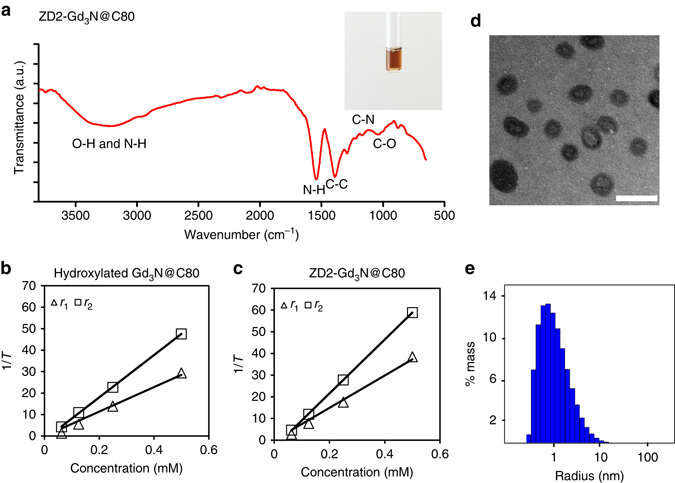
Characterisation of ZD2-Gd3N@C80. a Fourier transform infrared spectroscopy (FTIR) of ZD2-Gd3N@C80. Inset: photograph of ZD2-Gd3N@C80 aqueous solution (0.083 mM). Plots of 1/T 1 and 1/T 2 vs. contrast agent concentrations for calculation of r 1 and r 2 relaxivities of b hydroxylated Gd3N@C80 (r 1 = 171.3 mM−1 s−1; r 2 = 295.5 mM−1 s−1) and c ZD2-Gd3N@C80 (r 1 = 223.8 mM−1 s−1 and r 2 = 344.7 mM−1 s−1) at 1.5 Tesla. d TEM images (scale bar 5 nm) and e DLS size distribution of ZD2-Gd3N@C80 (average radius: 1.40 nm; polydispersity: 132%)