Figure 2.
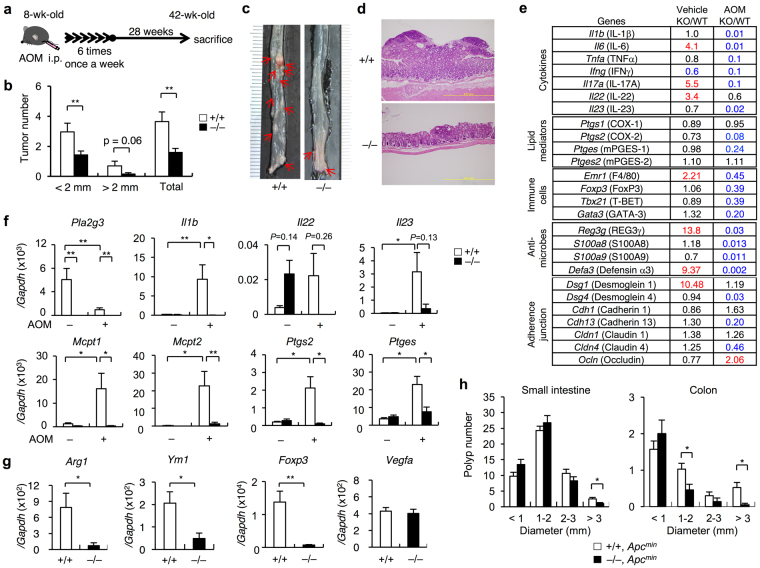
Pla2g3 −/− mice are protected against colorectal cancer. (a) Schematic representation of the procedure for AOM-induced colon cancer. (b) Number of total, small (<2 mm in diameter) and large (>2 mm) polyps per mouse in the colons of AOM-treated Pla2g3 −/− in comparison with littermate Pla2g3 −/− mice (n = 19–38). (c) Representative photographs of colon tissues from Pla2g3 +/+ and Pla2g3 −/− mice. Polyps are indicated by arrows. (d) Representative hematoxylin and eosin staining of the colon tissues from Pla2g3 +/+ and Pla2g3 −/− mice. Bar: 200 µm. (e) Microarray gene profiling of the whole descending colons of Pla2g3 −/− (KO) and littermate Pla2g3 +/+ (WT) mice with AOM or vehicle treatment. Equal amounts of total RNA (pooled from four mice for each genotype) were subjected to one-color gene expression microarray analysis. Data were processed using Agilent’s Feature Extraction Software and analyzed using GeneSpring Software. Fold changes (KO relative to WT) on the microarray are listed, and genes showing a >2-fold increase (red) or decrease (blue) in expression are highlighted. (f) Quantitative RT-PCR of Pla2g3 and several inflammatory genes in the colons of Pla2g3 +/+ and Pla2g3 −/− mice after treatment with or without AOM (n = 5–8). (g) Quantitative RT-PCR of genes for M2 macrophages, regulatory T cells, and angiogenesis in the colons of AOM-treated Pla2g3 +/+ and Pla2g3 −/− mice (n = 5). (h) Number of polyps per mouse in the small and large intestines of Pla2g3 +/+ Apc Min/+ and Pla2g3 −/− Apc Min/+ mice (4-month-old males) (n = 27–45). Mean ± SEM, *P < 0.05 and **P < 0.01. Results are from one experiment (e) or complied from at least two experiments (b,f–h).

