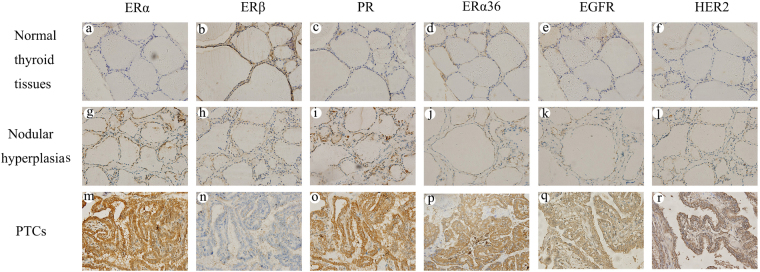
Figure 1.
Immunohistochemical staining for ERα, ERβ, PR, ERα36, EGFR and HER2. Columns correspond to immunostaining for ERα, ERβ, PR, ERα36, EGFR and HER2, respectively. The first row (a–f) shows the representatives of immunostaining for normal thyroid tissues. The second row (g–l) displays the representatives of immunostaining for nodular hyperplasias. The third row (m–r) shows the representatives of immunostaining for PTCs. All the pictures are in high-power fields (×400).

