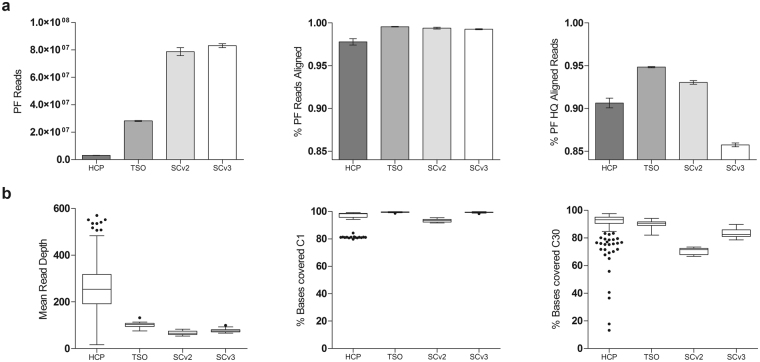
Figure 1.
Comparison of main coverage metrics. Average of all samples analyzed for the four different approaches. (a) Bar plots with 95% confidence interval for the four approaches. Alignment metrics: passing filter (PF) reads; percentage of PF reads that aligned to the reference sequence; and percentage of PF reads that were aligned to the reference sequence with a mapping quality of Q20 or higher signifying. (b) Tukey boxplots: Mean read depth; percentage of bases covered at C1; and percentage of bases covered at C30.

