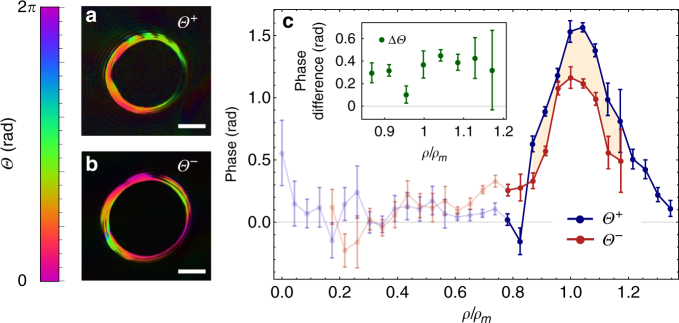
Fig. 4.
Experimentally observed phase shift of twisted electron beams upon interaction with a magnetic pillar. a and b show the digitally reconstructed phase shift for beams carrying OAM values of + 200 and −200, respectively. Scale bar represents 100 nm. c The points indicate the experimental data for measured relative phase changes that are obtained by the electron interferometer shown in Fig. 3. The error bars are based on standard deviations in different sets of measurements. Red and blue colors are the measured phases for beams carrying positive Θ + and negative Θ − OAM values of 200, that is, The relative phase ΔΘ is illustrated by the beige shaded area. These data were evaluated for regions close to ρ m = 0.16 m radius. Semi-transparent zones indicate regions where the probability of finding electrons is zero. The solid lines are obtained by interpolation

