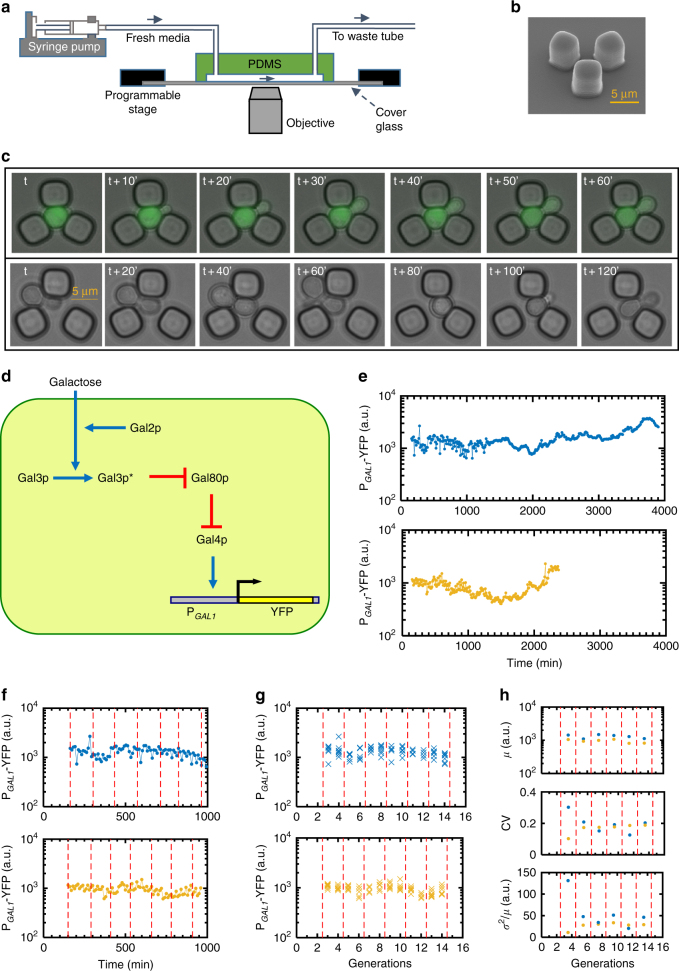
Fig. 1.
Experimental setup, galactose network, and single-cell fluorescence trajectories. a Schematics of the experimental setup. b SEM picture of a single replicator unit. Scale bar, 5 µm. c Sample time-lapse microscopy snapshots covering one cell generation (top) and illustrating the initial trapping of virgin cells (bottom). Scale bar, 5 µm. d Network architecture built by the four regulatory genes. The galactose-bound state of Gal3p is denoted by Gal3p*. Pointed blue arrows reflect activation and blunt red arrows reflect inhibition. e Two sample single-cell fluorescence trajectories in chronological order. Using cells of the wild-type strain, fluorescence level is measured every 10 min. f–h Illustration of analysis procedure. The red dashed lines indicate the boundaries of two-generation windows. f Chronological fluorescence measurements for the initial 1,000 min of the cells shown in e. g Chronological fluorescence measurements in f are assigned to the corresponding generations. Each cross mark represents one fluorescence measurement in that generation. h For each cell in g, the measurements within each two-generation window are used to calculate the mean, CV, and Fano factor of expression levels within that window for that cell

