Fig. 2.

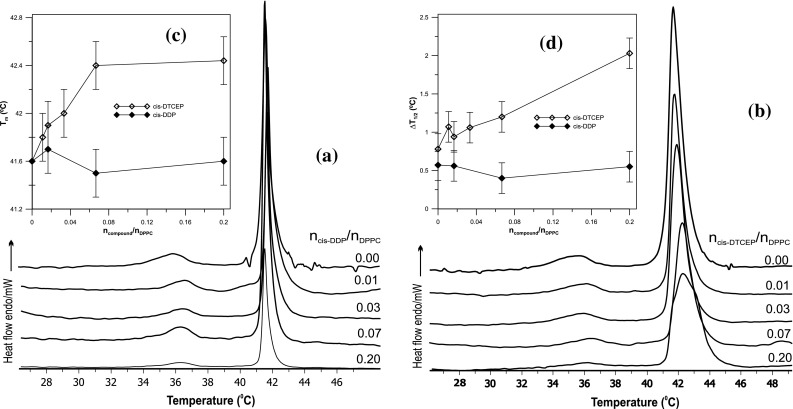
DSC transition curves of MLV with DPPC modified with the cis-DDP (a) and cis-DTCEP (b). Main phase transition temperature Tm (c) and half width ΔT1/2 peak (d) as a function of platinum(II) complexes concentration

DSC transition curves of MLV with DPPC modified with the cis-DDP (a) and cis-DTCEP (b). Main phase transition temperature Tm (c) and half width ΔT1/2 peak (d) as a function of platinum(II) complexes concentration