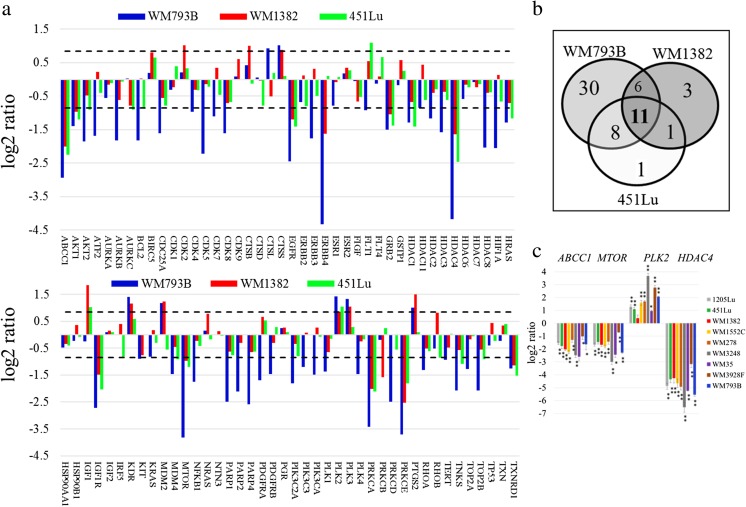
Fig. 5.
PCR array analysis and validation of results. Gene expression analysis in melanoma cells (WM793B, WM1382 and 451Lu) treated with 100 nM WP760 for 24 h (a). The diagram shows log2 ratios for all 84 transcripts (dotted lines signify fold regulation cut-off value of 1.8; Venn diagram showing numbers of genes with altered expression (b). qRT-PCR validation of four genes in a panel of 9 cell lines (c). The results are presented as mean ± SD of three biological replicas (* P-values <0.05, ** P-values <0.01; Student’s t-test)

