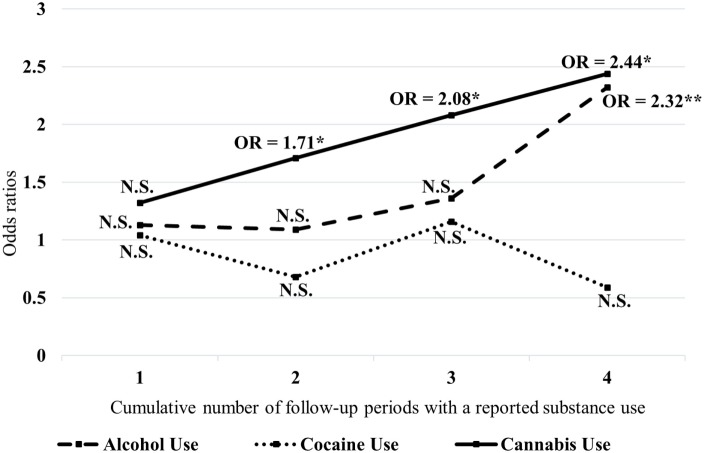
Figure 1.
Odds ratios for violent behaviors associated with substance use across each time points. x-Axis represent the number of follow-up periods with substance-use, y-axis represent the Odds Ratios; Reference is no use of substance across time points; Odds Ratios are controlled for the effects of time, other substances used at each time point, age, age at first hospitalization, sex, ethnicity, Schizophrenia-Spectrum disorders (presence/absence), affective disorders (presence/absence), psychopathic traits (PCL), impulsivity (BIS-11) (*p < 0.05; **p < 0.01; ***p < 0.001; N.S., Not statistically significant).

