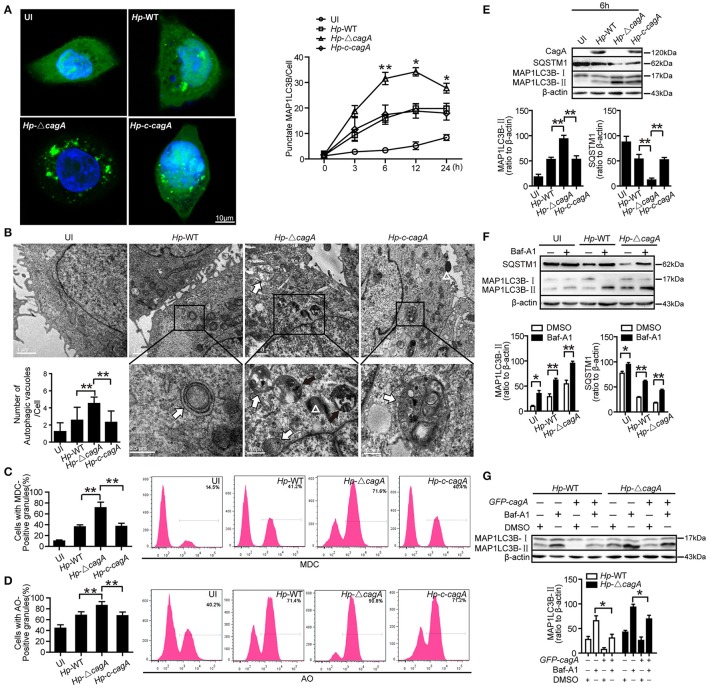
Figure 3.
CagA could inhibit the generation of autophagosomes in AGS cells. (A) Confocal microscopy showing AGS cells transfected with GFP-MAP1LC3B without H. pylori infection (UI), and transfected AGS cells with the wild type H. pylori (Hp-WT), the cagA-knockout H. pylori (Hp-ΔcagA) or the cagA-knockout complementation mutant H. pylori (Hp-c-cagA) (MOI = 100:1) infection for 6 h (left) and the indicated periods of time (right). Scale bars: 10 μm. The number of GFP-MAP1LC3B puncta in each cell (n ≥ 200 cells) was counted. (B) Representative transmission electron microscopy showing AGS cells without H. pylori infection and those infected with Hp-WT, Hp-ΔcagA, or Hp-c-cagA (MOI = 100:1) for 6 h. The white arrows indicate autophagosomes, and the black arrows indicate autolysosomes, and the white triangle indicate H. pylori. The numbers of autophagic vacuoles per cell in each TEM section (n = 35 cells) are shown in the lower left graph and the data are expressed as mean ± SEM. (C,D) Flow cytometry showing MDC and AO staining of AGS cells 6 h after infection with Hp-WT, Hp-ΔcagA, or Hp-c-cagA (MOI = 100:1). (E) Western blotting showing the protein levels of CagA, SQSTM1, and MAP1LC3B-II with the rates of SQSTM1 and MAP1LC3B-II to β-actin in AGS cells infected with Hp-WT, Hp-ΔcagA, or Hp-c-cagA (MOI = 100:1) for 6 h. (F) Measurement of MAP1LC3B-II conversion and SQSTM1 in AGS cells infected with Hp-WT or Hp-ΔcagA (MOI = 100:1) for 6 h in the presence of Baf-A1 (10 nM). (G) AGS cells were transfected with GFP-CagA, and then infected with Hp-WT or Hp-ΔcagA (MOI = 100:1) for 6 h in the presence of Baf-A1 (10 nM). Results shown are representative of three independent experiments. *P < 0.05, **P < 0.01.

