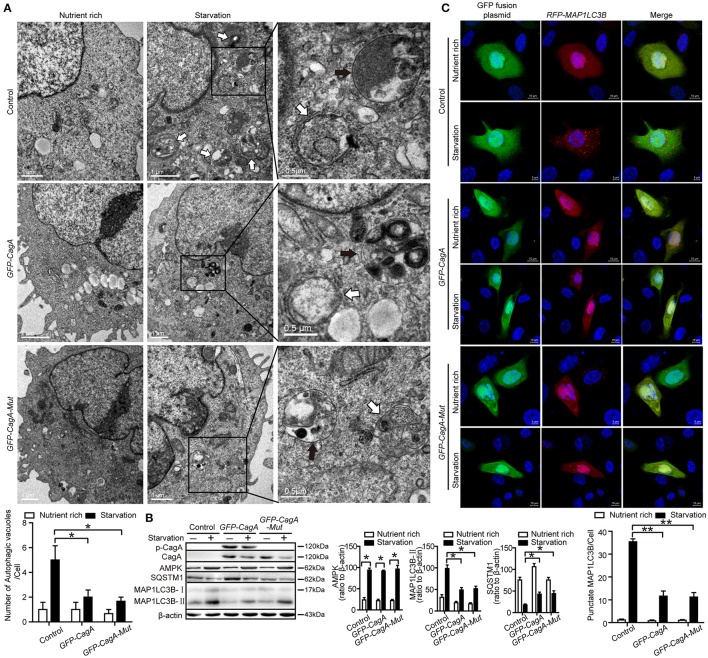
Figure 4.
CagA down-regulates starvation-induced autophagy in AGS cells. (A) Transmission electron microscopy showing autophagic vacuoles in AGS cells transfected with GFP-CagA, GFP-CagA-Mut, or a control (pEGFP-C1) plasmid before pretreatment of normal media or subjected to 4 h starvation. The white arrows indicate autophagosomes, and the black arrows indicate autolysosomes. The numbers of autophagic vacuoles per cell in each TEM section (n = 35 cells) are shown in the lower graph and the data are expressed as mean ± SEM. (B) Western blot assay showing MAP1LC3B-II conversion and expression of p-CagA, CagA, AMPK, and SQSTM1 in AGS cells transfected with GFP-CagA, GFP-CagA-Mut, or a control (pEGFP-C1) plasmid in the nutrient rich medium or 4 h starvation. (C) Confocal microscopy showing AGS cells co-transfected with RFP-MAP1LC3B and GFP-CagA, GFP-CagA-Mut, or a control (pEGFP-C1) plasmid in the nutrient rich medium or 4 h starvation. Scale bars: 5 or 10 μm. The number of RFP-MAP1LC3B puncta in each cell (n ≥ 200 cells) was counted. Experiments were performed in triplicate, and all replicates showed similar results. *P < 0.05, **P < 0.01.

