FIGURE 4.

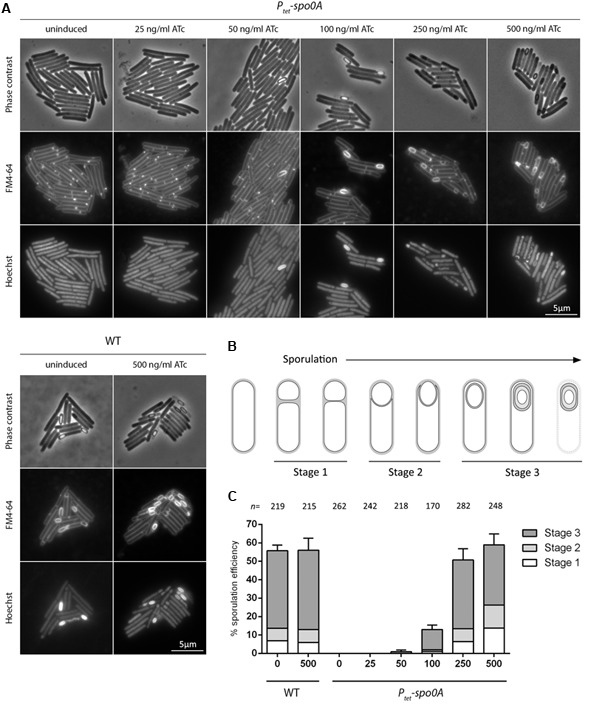
Analysis of Ptet-spo0A sporulation dynamics. (A) WT and Ptet-spo0A cultures were harvested after 14 h of growth on 70:30 agar supplemented with ATc as indicated. Cells were stained with FM4-64 and Hoechst 33258 and analyzed by phase contrast and fluorescence microscopy. Scale bar corresponds to 5 μm. (B) Schematic representation of the sporulation process indicating stages corresponding to asymmetric cell division (stage 1), engulfment (stage 2) and spore maturation (stage 3). (C) Sporulation efficiency and distribution of cells at different stages of sporulation in WT and Ptet-spo0A grown for 14 h on 70:30 agar supplemented with ATc as indicated. Sporulation efficiency is expressed as the percentage ratio of cells at a given stage of sporulation to total cells counted. Data reported as means ± SD from 10 random fields of view. The total number of cells counted (n) is indicated above each column on the graph.
