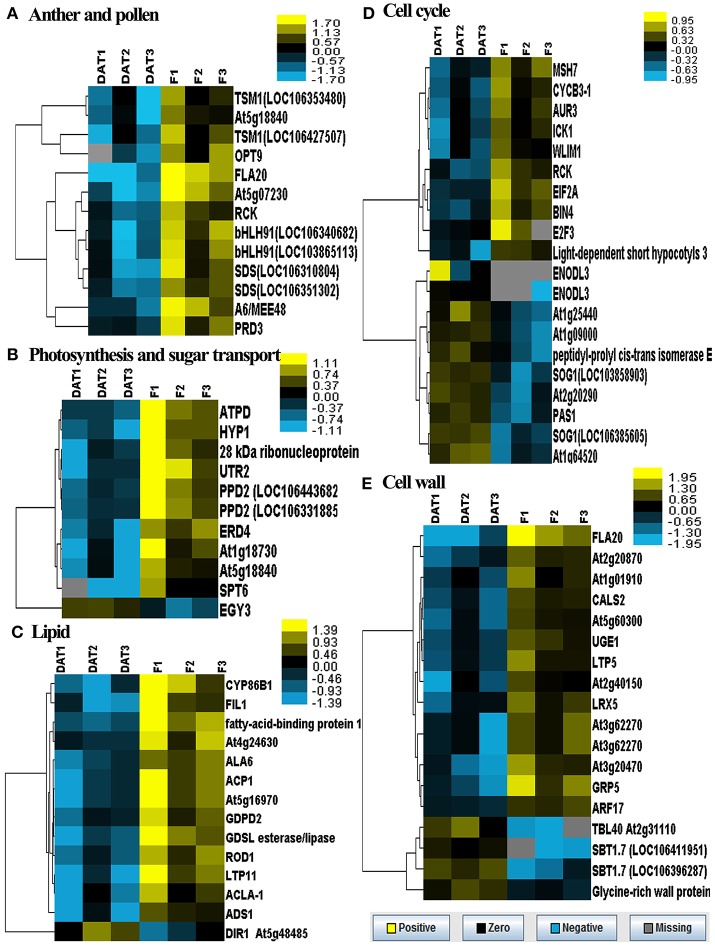
Figure 6.
Heatmaps of log-transformed expression level of five groups of selected DETs in the two groups of flower bud samples. DAT1, DAT2, and DAT3 represent the replicates of amidosulfuron treatment and F1, F2, and F3 represent the replicates of control. (A) Genes related to anther and pollen development. (B) Genes related to photosynthesis and sugar transport. (C) Genes related to lipid metabolism. (D) Genes related to cell cycle. (E) Genes related to cell wall construction. The detailed gene information was listed in Data Sheet S1, highlighted with yellow background color.

