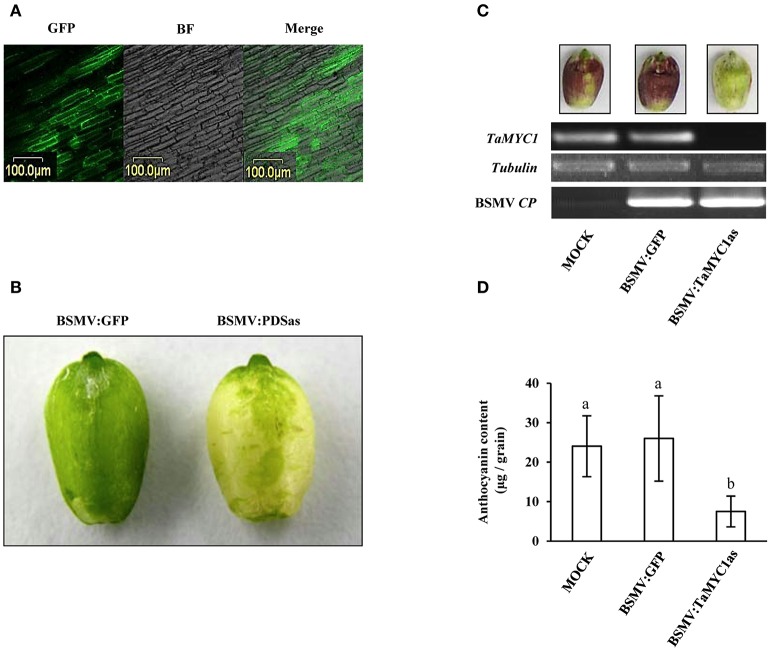
Figure 4.
Analysis of the function of TaMYC1 in regulating anthocyanin biosynthesis using virus induced gene silencing. Three recombinant barley stripe mosaic viruses (BSMV:GFP, BSMV:PDSas, and BSMV:TaMYC1as) were used in this experiment. Wheat plants (cv Gaoyuan 115) were inoculated with the three viruses, respectively. The developing grains were used for the experiment 14 days after the flowering. (A) GFP fluorescence was detected in the developing grains of the plants infected by BSMV:GFP. The images shown were taken under a confocal microscope in GFP channel and bright field (BF), respectively, followed by merging. (B) Photo bleaching was observed in the developing grains of the plants infected by BSMV:PDSas because of silencing the expression of phytoene desaturase gene. The bleaching phenotype did not occur in the developing grains of the plants infected by BSMV:GFP. (C) Evaluation of the relative transcript levels of TaMYC1 and BSMV CP gene in the developing grains of mock controls and the plants infected by BSMV:GFP or BSMV:PDSas. The grains were subjected to glume removal, and at 2 days after the treatment, they were collected for this analysis. Purple anthocyanin pigments were induced in the grains of mock controls and the plants infected by BSMV:GFP but not those infected by BSMV:TaMYC1as. Consistent with this finding, TaMYC1 transcripts accumulated in the grains of mock controls and the plants infected by BSMV:GFP, but were undetectable by RT-PCR in the grains of the plants infected by BSMV:TaMYC1as. Successful infection of the developing grains by BSMV:GFP or BSMV:PDSas was confirmed by positive detection of viral CP transcripts. The results depicted are representative of three independent experiments. (D) Comparison of anthocyanin contents among the developing grains of mock controls and the plants infected by BSMV:GFP or BSMV:TaMYC1as. The three sources of grains, as shown in (C), were individually assayed for anthocyanin content, with the averaged values (means ± SE, n = 20) being compared statistically. The means marked by different letters are statistically significant (P < 0.05). The data shown were reproducible in another two separate determinations.

