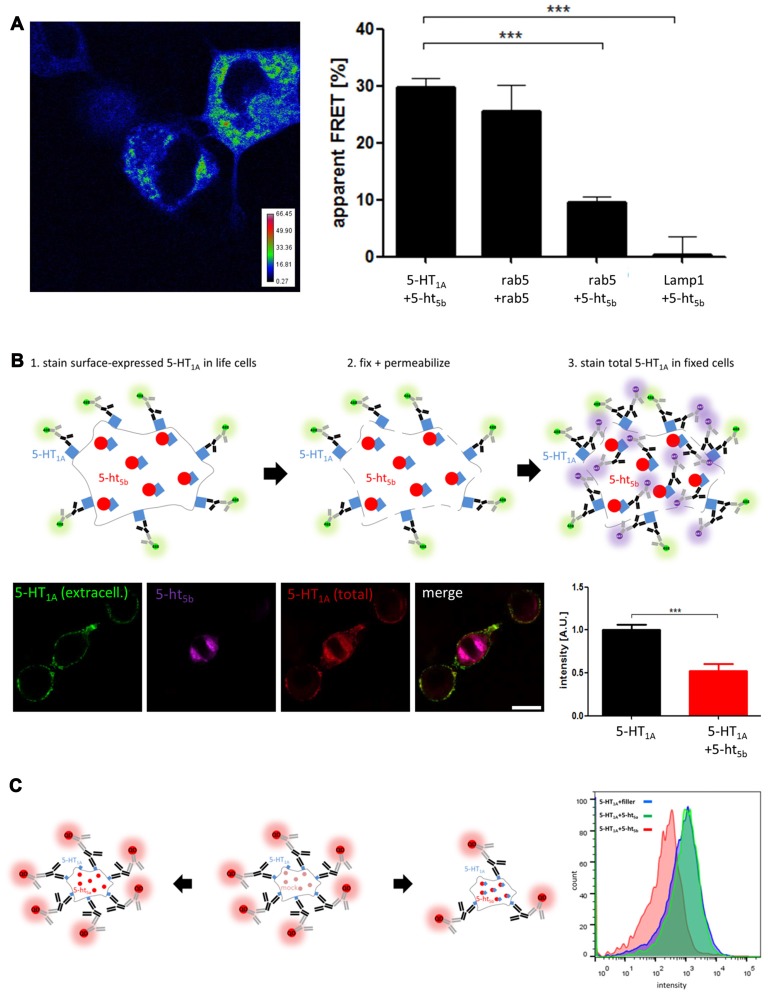
Figure 4.
Analysis of receptor interaction. (A) Acceptor-photobleaching Förster Resonance Energy Transfer (abFRET) microscopy was used to determine the extent of protein:protein-interaction. Protein pairs of 5-HT1A:5-ht5b, rab5:rab5, 5-ht5b:rab5 and 5-ht5b:Lamp1 were co-expressed in N1E-115 cells at equimolar concentrations and the apparent FRET efficiency (Fapp) was measured. The color-coded image shows an exemplary experiment of 5-HT1A:5-ht5b, while the bar diagram shows the apparent FRET efficiencies of 5-HT1A:5-ht5b (29.74 ± 1.6), rab5:rab5 (25.58 ± 4.6), 5-ht5b:rab5 (9.56 ± 1.1) and 5-ht5b:Lamp1 (0.02 ± 0.7). Asterisks indicate significance (***p ≤ 0.001; one-way-ANOVA with Bonferroni’s post-test for multiple comparisons). (B) Immunohistochemical analysis of distribution and equal expression levels. Non-permeabilized cells were stained for 5-HT1A (green), then fixed and permeabilized and stained again for 5-HT1A (purple). 5-ht5b is co-expressed in some cells as a fusion protein with a fluorescent tag (red). The fluorescence intensity of the first 5-HT1A staining was then measured in cells expressing 5-HT1A and in cells expressing 5-HT1A and 5-ht5b. The cartoon shows the experimental procedure. The bar diagram shows the mean fluorescence intensities of 5-HT1A reactivity in cells expressing only 5-HT1A and in cells expressing 5-HT1A (1.0 ± 0.06) and 5-ht5b (0.52 ± 0.08) (***p ≤ 0.001; unpaired t-test). (C) The effect of 5-HT1A:5-ht5b co-expression on 5-HT1A surface localization was quantified by fluorescence activated cell sorting (FACS) analysis of N1E-115 cells expressing HA-5-HT1A alone or together with 5-ht5b. Expressing 5-HT1A together with an equal amount of filler DNA was used to determine 5-HT1A surface expression under control conditions (blue). Co-expression of 5-HT1A with an equal amount of non-interacting 5-ht5a did not change the degree of surface expression (green). Co-expression of 5-HT1A with an equal amount of 5-ht5b decreased the cell surface expression of 5-HT1A by 48.8% ± 17.4%. The cartoon shows the experimental procedure. Labeling was directed at HA-tag on 5-HT1A with quantum dot-coupled secondary antibodies. To avoid skewing results by transcription level effects in the control measurement, an unspecific filler plasmid (mock) was co-transfected in place of the second receptor to maintain the same total amount of transfected plasmid.

