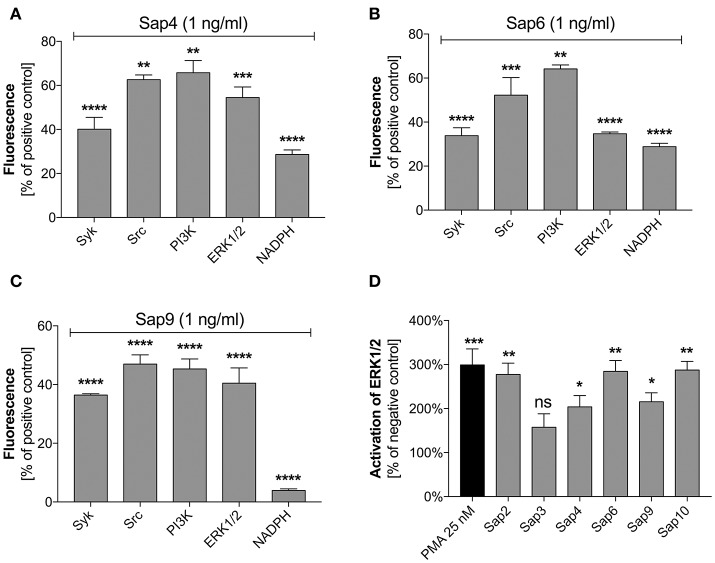
Figure 11.
Role of selected signal mediators in Sap-triggered netosis. (A–C) Neutrophils (2.2 × 10⁵) were preincubated with inhibitors of the indicated signaling mediators: Syk—30 μM piceatannol, Src—10 μM PP2, PI3K—25 μM LY29004, ERK—10 μM U0126, NADPH oxidase—5 μM DPI. These cells were then incubated with Sap4 (A), Sap6 (B), or Sap9 (C) at concentrations of 1 ng/ml for 3 h to induce netosis. Neutrophils not treated with inhibitors but stimulated with Saps served as controls. The data are presented as means ± SEM from three independent experiments (in duplicate) and are expressed as a percentage ratio relative to the PMA-induced control. (D) Lysates were prepared for neutrophils treated with selected Saps at concentration of 1 mg/ml. The levels of phosphorylated and total ERK1/2 were then determined in these cells using an ELISA method. Unstimulated cells were used as a negative control. Data are the ratios of the phosphorylated kinase to total kinase. Data are presented as mean ± SEM of three independent experiments. Asterisks denote statistical significance relative to the negative control (*p < 0.05, **p < 0.01, ***p < 0.005, ****p < 0.001, ns—not significant).

