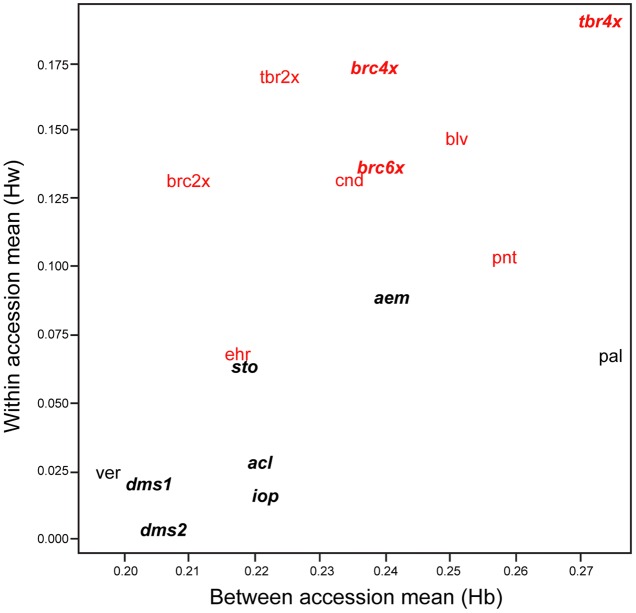
FIGURE 1.
Within (Hw) vs. between (Hb) species diversity of the accessions examined here. Species and accession codes refer to Table 1 and the data point lies under the center of the code. Polyploid species are shown in bold italic. Self-compatible species are shown in black and self-incompatible in red.

