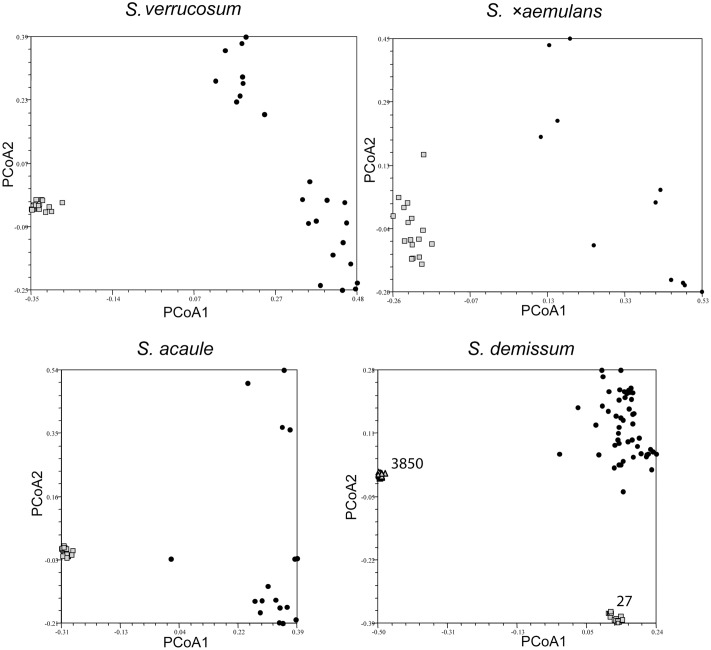
FIGURE 2.
Principal coordinate analysis showing clustering of individuals in single genebank accessions of self-compatible species Solanum verrucosum, S. acaule, S. ×aemulans, S. demissum relative to a broader species sample, represented by single individuals from several genebank accessions. The relevant accessions are shown as lightly shaded (squares and triangles); the individuals representing the taxon as black circles.

