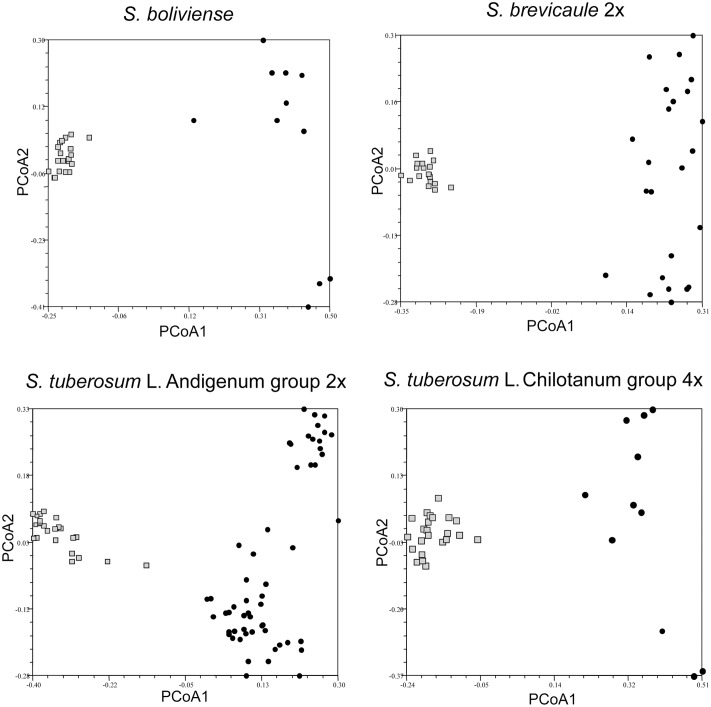
FIGURE 3.
Principal coordinate analysis showing clustering of individuals in single genebank accessions of self-incompatible species Solanum boliviense, S. brevicaule 2x, S. tuberosum Andigenum group (2x), S. tuberosum Chilotanum group (4x) relative to a broader species sample, represented by single individuals from several genebank accessions. The relevant accessions are shown as lightly shaded (squares and triangles); the individuals representing the taxon as black circles.

