Figure 1.
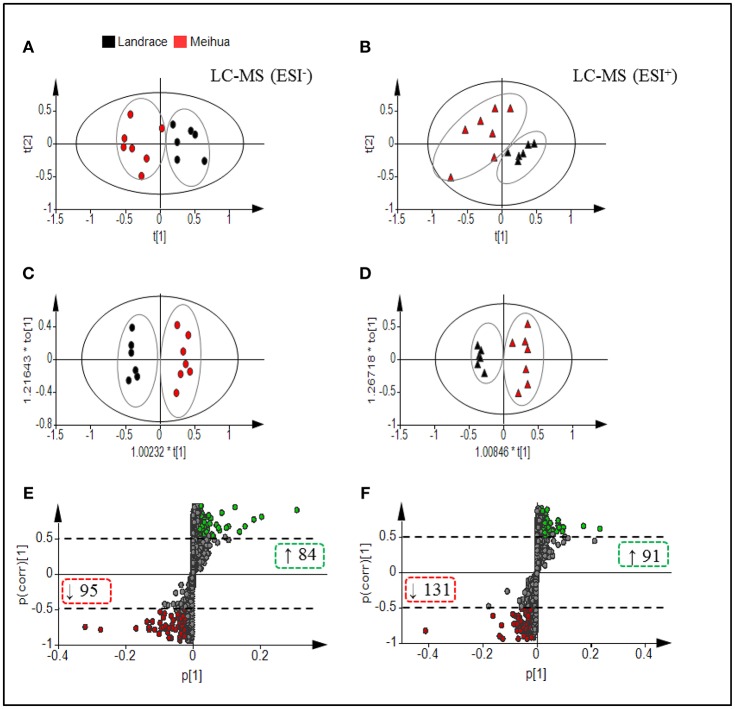
Multivariate statistical analysis of untargeted metabolomic data obtained using the LC-MS/MS approach. PCA Score plot of colonic metabolomic data for Landrace (black) and Meihua (red) piglets obtained by (A) LC-MS (ESI−) and (B) LC-MS (ESI+). (C) OPLS-DA Score plot of colonic metabolomic data obtained by LC-MS (ESI−); R2Y = 0.976, Q2 = 0.816; and P(CV-ANOVA) = 0.0049. (D) OPLS-DA Score plot of colonic metabolomic data obtained by LC-MS (ESI+) data; R2Y = 0.963, Q2 = 0.73 and P (CV-ANOVA) = 0.021. (E) S-plot of LC-MS (ESI-) data with 3,480 metabolite signals detected. (F) S-plot of LC-MS (ESI+) data with 3,864 metabolite signals detected. Red circles in S-plots are model-separated metabolites following the conditions of VIP >1 and | P (corr)| ≥ 0.5 with 95% jack-knifed confidence intervals. Red or green rectangles in S-plots identify the numbers and tendency of metabolites to separate in the model when Meihua piglets are compared with Landrace piglets.

