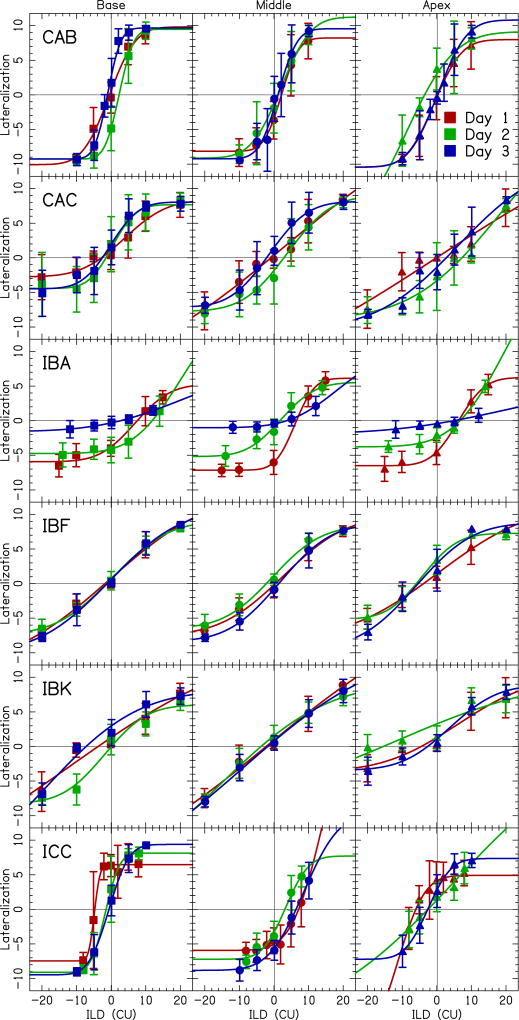
Figure 7.
Shown here are data for the lateralization task for the six participants who completed this task on three consecutive days. Within a given participant, the left panel corresponds to the basal electrode pair, the center panel corresponds to the middle pair, and the right panel corresponds to the apical electrode pair. Squares reflect data from the basal electrode pair, circles from the middle pair, and triangles from the apical pair. Different testing sessions are represented by different colors where red is day 1, green is day 2, and blue is day 3. Data points show the mean lateralization for a condition. Error bars indicate ± one standard deviation from the mean. Fits to the data were performed using a cumulative normal distribution function.

