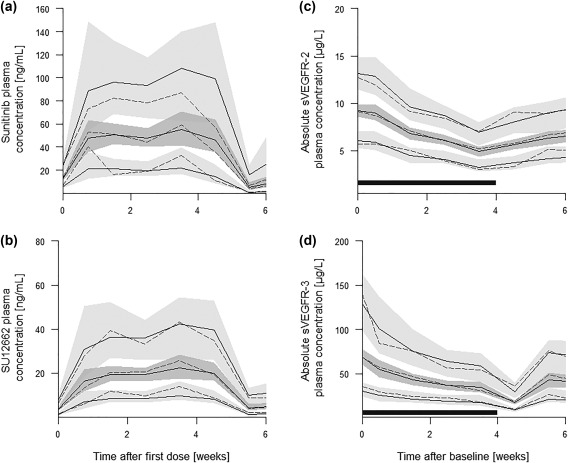
Figure 2.

Prediction‐corrected visual predictive checks of (a) the final pharmacokinetic (PK) model of sunitinib, (b) the final PK model of SU12662, (c) the soluble vascular endothelial growth factor receptor (sVEGFR)‐2 model, and (d) the sVEGFR‐3 model for one treatment cycle. Solid lines indicate the estimated mean as well as the 90% prediction interval. Dashed lines show the respective observed mean and interval. Shaded gray areas represent the 90% confidence band of the predictions. The dark gray rectangle indicates the time of treatment.
