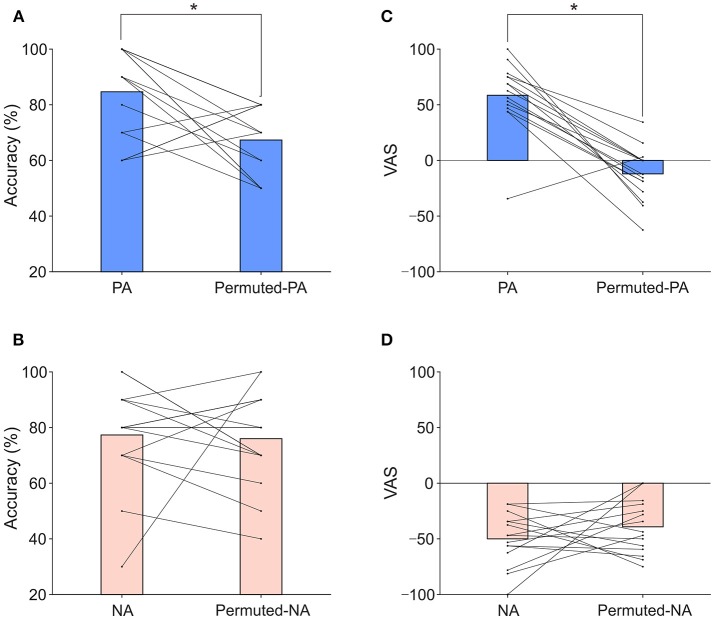
Figure 2.
Classification accuracies and VAS scores. (A) Classification accuracies of PA and permuted-PA. (B) VAS scores of PA and permuted-PA. (C) Classification accuracies of NA and permuted-NA. (D) VAS scores of NA and permuted-NA. The bar represents the mean classification accuracy or VAS score. The line and dot represent individual classification accuracies or VAS scores. Asterisks indicate significant differences revealed by the post-hoc test (p < 0.025).

