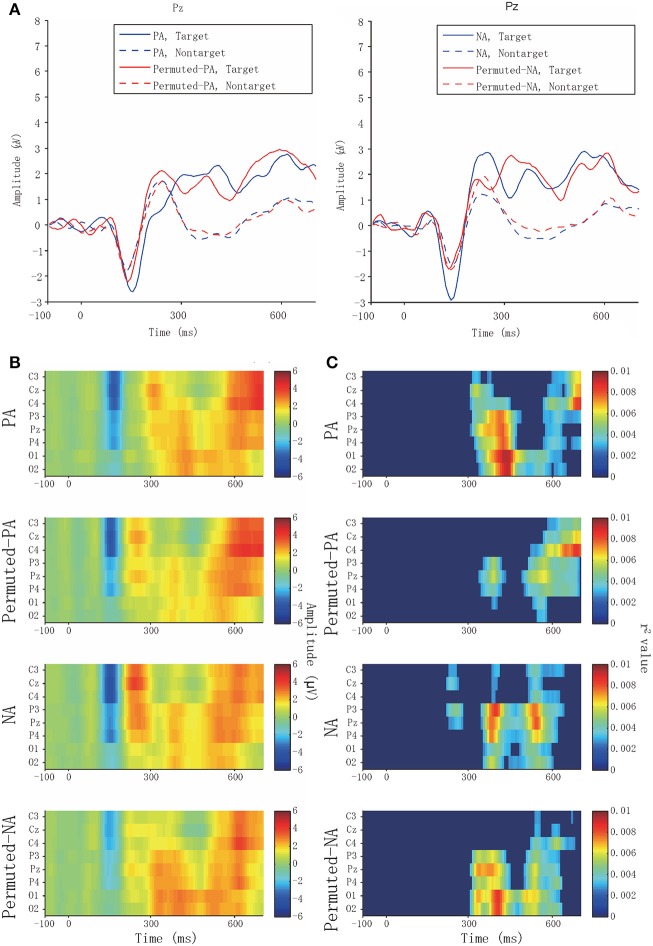
Figure 3.
Averaged waveforms and biserial correlation coefficients (r2 value). (A) Target and non-target averaged waveform of PA, permuted-PA, NA, and permuted-NA at Pz. Solid and broken lines represent the target and non-target ERPs, respectively. The blue lines represent PA or NA, and the red lines represent permuted-PA or permuted-NA. (B) Averaged waveforms in PA, permuted-PA, NA, and permuted-NA observed from eight channels. (C) Biserial correlation coefficients in PA, permuted-PA, NA, and permuted-NA. The biserial correlation coefficients were visualized as zero if the point-biserial correlation was determined to be insignificant through a test of no correlation.

