Figure 4.
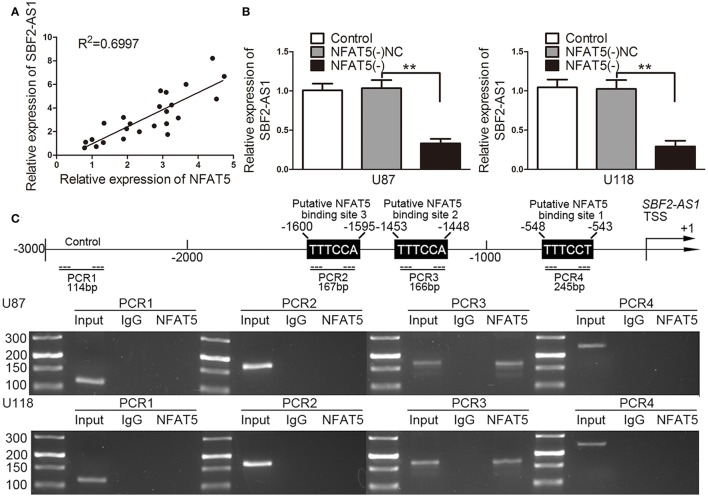
NFAT5 regulated SBF2-AS1 at transcriptional level. (A) Linear regression analysis was performed to each individual NFAT5 and SBF2-AS1 expression, P < 0.01. (B) NFAT5 was knockdown in U87 and U118 cells. SBF2-AS1 levels in U87 and U118 cells were measured by qRT-PCR. Data represent mean ± s.d. (n = 4, each). **P < 0.01. (C) Schematic representation of the human SBF2-AS1 promoter region. Chromatin immunoprecipitation PCR products for putative NFAT5-binding sites and an upstream region not expected to associate with NFAT5 are amplified by PCR using their specific primers (n = 3, each).

