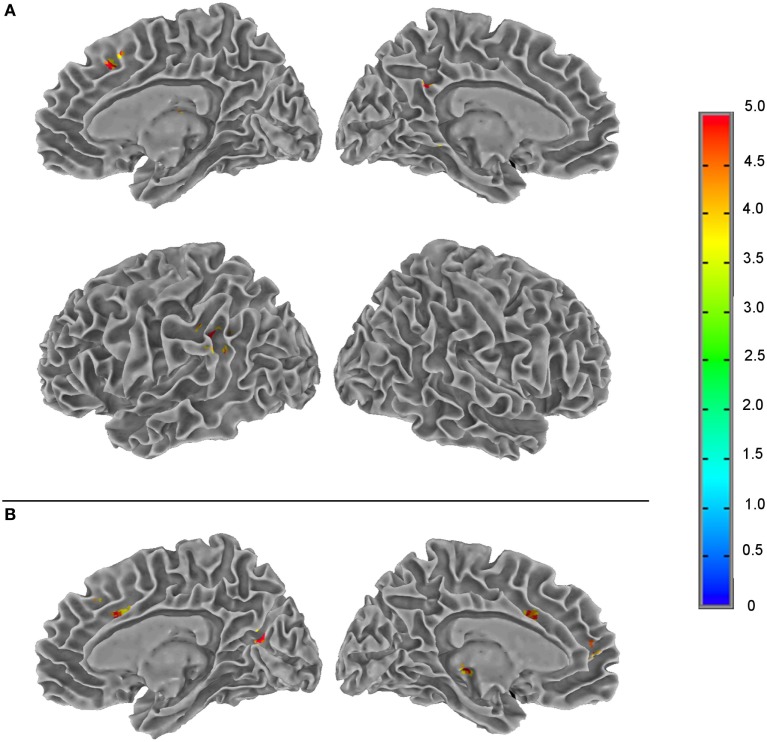
Figure 4.
Summary of the F-score results from the three-way ANOVA modeling of the regional cerebral blood flow data acquired during a 20-min psychomotor vigilance task (PVT) performance to illustrate the brain regions of statistically significant differences (family-wise error rate, p ≤ 0.05) in neural activity associated with the two fixed factors (the PVT performance time and subject group) and their interaction. (A) The effect of PVT performance time; (B) the interaction effect between the PVT performance time and subject groups. The color bar indicates the F-score of the three-way ANOVA results.

