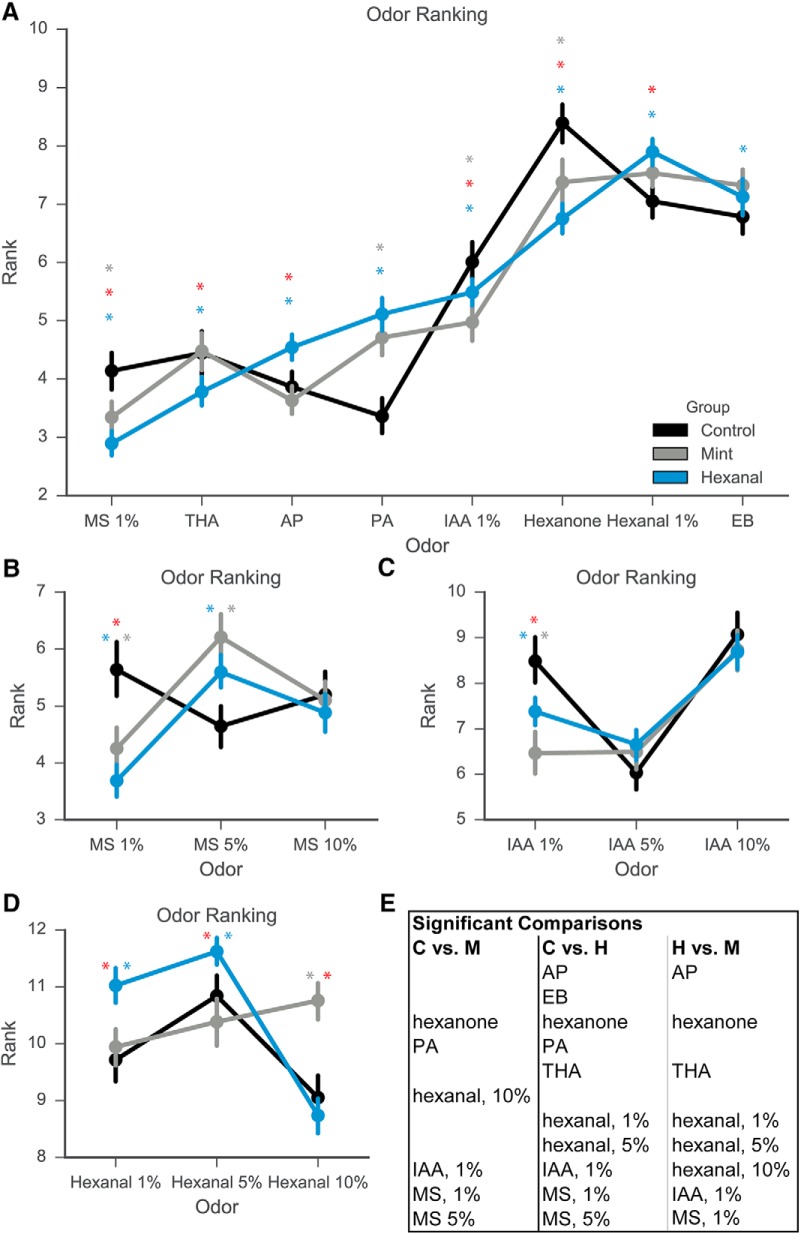
Figure 7.
Odor ranking changes for specific odorants following odor exposure. A, Response rank for each odor calculated on a cell-by-cell basis. Odorants at 1% concentration displayed. B--D, Response rank for multiple concentrations of MS (B), IAA (C), and hexanal (D). E, Table of significant differences in odorant ranks for each group comparison. Gray asterisk, statistically significant difference between mint and control groups; blue asterisk, statistically significant difference between hexanal and control; red asterisk, statistically significant difference between hexanal and mint.

