. 2017 May 9;8(7):5030–5040. doi: 10.1039/c7sc00620a

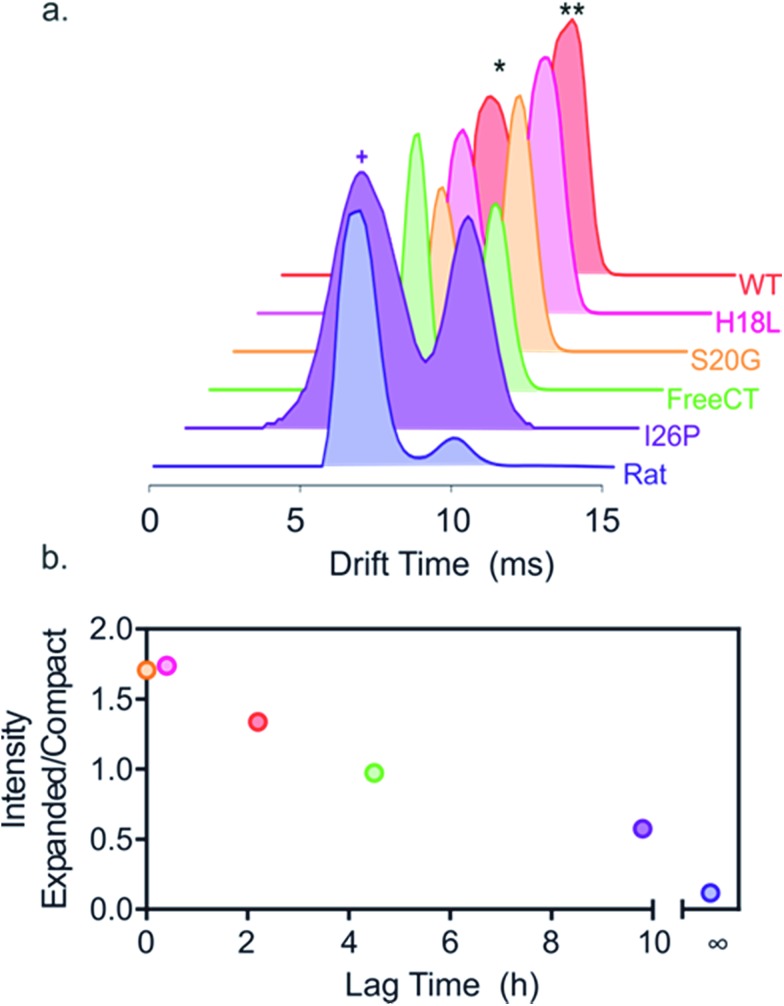
Fig. 3. Different relative populations of IAPP monomer 2+ ions correlate with the lag time of assembly. (a) ESI-IMS-MS arrival time distributions show that 2+ monomer ions of each variant occupy two dominant conformers (* and **, highlighted for WT). I26P (purple) also occupies additional more compact conformers (purple +), not observed for the other peptides. Experimental CCSs of these 2+ monomers, measured using ESI-IMS-MS, are 4.4 and 5.8 nm2, respectively. The more compact I26P monomer conformation has a CCS of 4.1 nm2. The experimental error is ± 5% for all cross-sections measured using IMS-MS calibration.38,61 (b) Plot of relative area under peaks of compact/expanded monomeric conformers (drift times ∼6.0 and 9.8 ms, respectively) vs. the lag time of fibril assembly (colored as in (a)). The lag time of Rat IAPP is denoted as infinity (∞).

Fig. 3