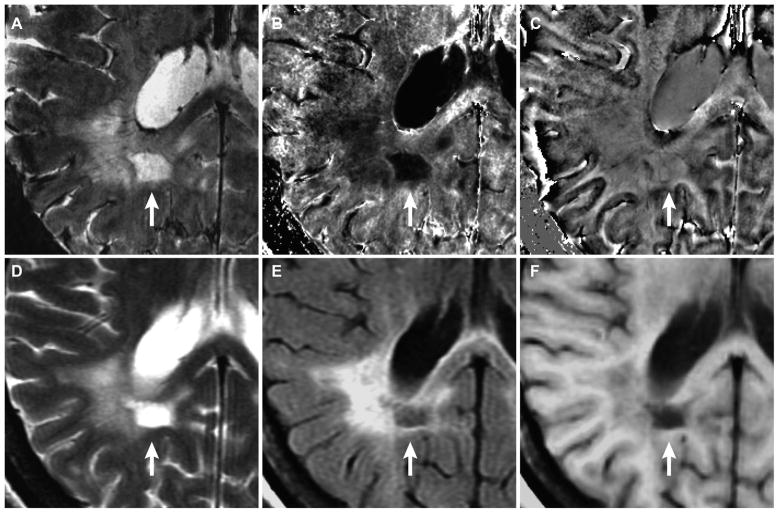
Fig. 3.
WM-L with a rim of increased signal in R2* WM-L with a rim of increased signal in R2* (white arrow) identified in magnitude (A), R2* (B), and phase (C) map in a SPMS patient with 33 years of disease and EDSS score of 6.0 (patient-5 in Tables 2 and 3). The lesion is only part of a larger lesion seen in T2-w FSE (D), T2-w FLAIR (E) image, and T1-w SE (F) image. The lesion also corresponds with a black hole on FLAIR image, indicating end-stage cavitation.

