Fig. 4.
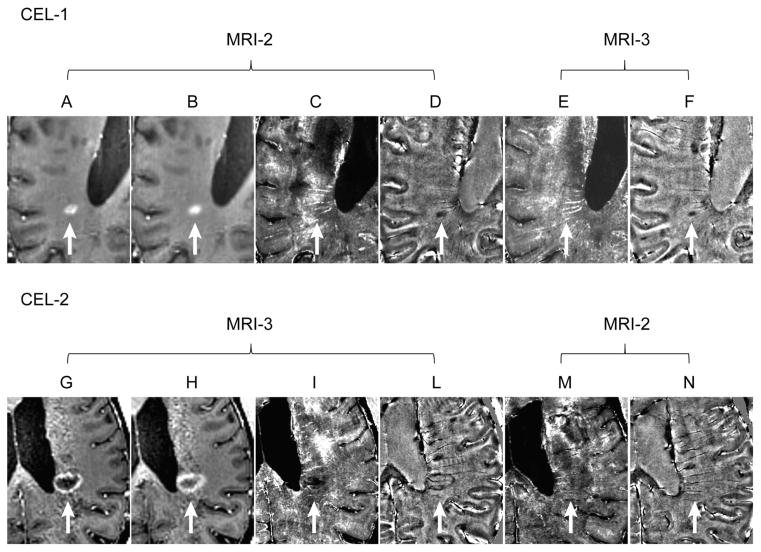
Active lesions with and without a rim of elevated R2 CEL-1 (white arrow) seen in the T1-w MPRAGE of MRI-1 obtained 5 minutes post-Gd injection (A) and 40 minutes post-Gd injection (B). The R2* and phase maps show the central core of the enhancing lesion had an decreased R2* (C) and a reduced phase (ie, paramagnetic shift) (D). No clear signal alterations ascribable to the prior presence of that CEL could be unambiguously identified in the R2* map of MRI-3 (E) obtained a month later when the CEL was no longer enhancing. Residual smaller area with a paramagnetic phase shift was visible in the phase map (F) of MRI-2. CEL-2 in MRI-3 is indicated with white arrow. This CEL presented with a ring-enhancing pattern in the T1-w MPRAGE obtained 5 minutes (G) 40 minutes post-Gd injection (H). The ring-enhancing contour coincided with a rim of elevated R2* signal (I) and paramagnetic phase shift (L). Minimal signs of signal alterations corresponding to the presence of this lesion were present in the R2* (M) but not on the phase (N) images obtained a month earlier. The fainting nature of this signal may signify an artifact. One cannot, however, unambiguously exclude minimal brain barrier leakage and iron deposition associated with it. These data were derived from a patient with RRMS, 7.5 years of disease and EDSS score of 2.5 (patient-8 in Tables 2 and 3).

