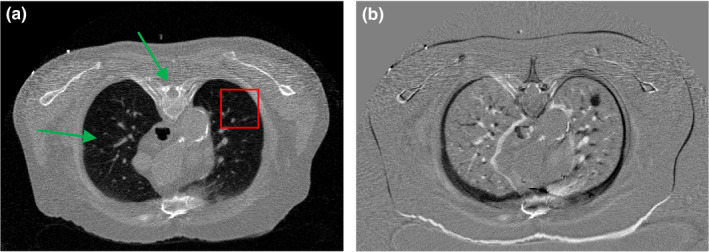
Figure 12.

(a) Another transverse slice of patient #1 without lung nodule, reconstructed by the FBP method from simulated low‐dose projection data; (b) The difference image between Figs. 1(c) and 12(a), indicating the mismatch between the prior image and the current LDCT image. The display window is [0, 0.034] mm−1 for Fig. 12(a), and is [−0.02, 0.02] mm−1 for Fig. 12(b).
