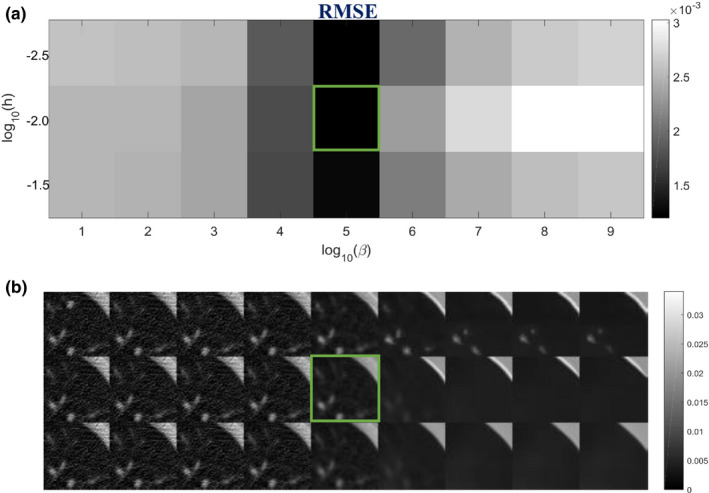
Figure 13.

Investigation of smoothing parameters: (a) RMSE of the ROI in Fig. 12(a) using different h and β values; (b) The corresponding reconstructions of ROI using different h and β values. The box indicates the lowest RMSE and the associated SIR‐ndiNLM reconstruction.
