Fig. 4.

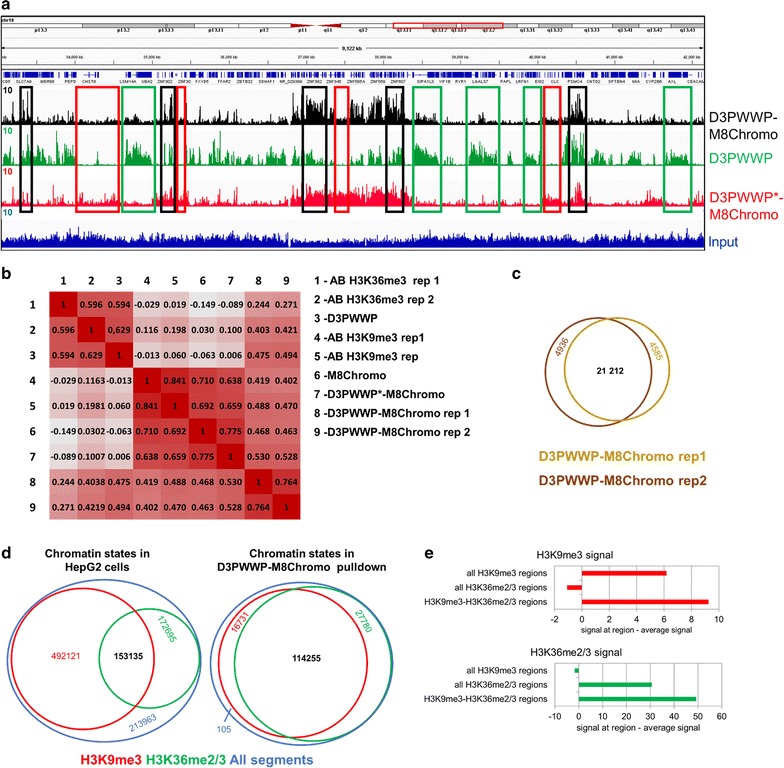
CIDOP-seq with the D3PWWP-M8Chromo double-HiMID. a Genome browser view of the CIDOP-seq signal from D3PWWP-M8Chromo and its variants. Note that strong D3PWWP-M8Chromo signal is only observed when DNMT3A PWWP and D3PWWP*-M8Chromo signals are present (black boxes). The green boxes denote examples of the presence of DNMT3A PWWP signal and the absence of D3PWWP*-M8Chromo signal. The red boxes denote examples the presence of D3PWWP*-M8Chromo signal and the absence of DNMT3A PWWP signal. b Heatmap of the Spearman correlation coefficients of raw read densities in 10-kb bins of D3PWWP-M8Chromo and D3PWWP*-M8Chromo CIDOP results with D3PWWP CIDOP and various antibody ChIP-seq data taken from Kungulovski et al. [37]. c Peak overlap between D3PWWP-M8Chromo replicates 1 and 2. d Analysis of chromatin states in HepG2 cells based on H3K9me3 and H3K36me2/3 CIDOP-seq signals using 3-kb bins. The red circle indicates the number of regions with H3K9me3 signal, the green circle indicates regions with H3K36me2/3 signal, and the blue circle indicates all regions. Red numbers refer to only H3K9me3 regions, green number to only H3K36me3 region, black numbers to regions with both signals, blue numbers to regions without both signals. The pull-down by D3PWWP-M8Chromo shows a strong and selective enrichment of the H3K9me3–H3K36me2/3 dual state. See also Additional file 1: Figure S4. e Average H3K9me3 and H3K36me2/3 signal intensity determined with the single reading domains at all H3K9me3 regions, all H3K36me2/3 regions and regions carrying the H3K9me3–H3K36me2/3 double mark. In each case, the genome-wide average signal has been subtracted
