Fig. 7.

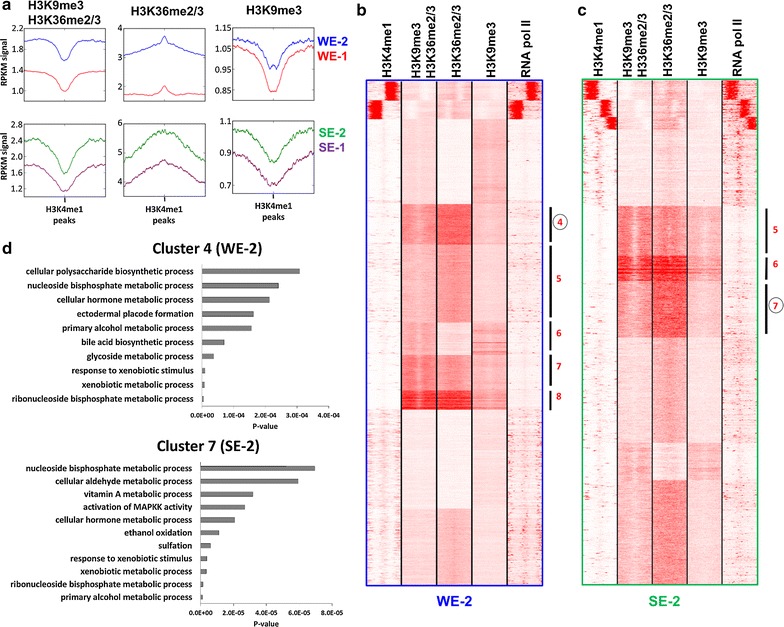
Association of the H3K9me3–H3K36me2/3 bivalent state with enhancer types. a Composite profiles of H3K9me3–H3K36me2/3, H3K9me3 and H3K36me2/3 distribution, centered on H3K4me1 peaks associated with the indicated types of enhancers. b, c Clustering analysis of tag densities of H3K9me3–H3K36me2/3, H3K9me3, H3K36me2/3 and RNA pol II. Tags were collected in 10-kb windows (− 5 to + 5 kb) centered on the midpoints H3K4me1 peaks associated with the chromatin states WE-2 (b) or SE-2 (c) and sorted by k-means clustering (ten clusters). Clusters with clear H3K9me3–H3K36me2/3 signal are labeled with red numbers. Other clusters not showing strong H3K9me3–H3K36me2/3 signal are not annotated. The image also shows that H3K9me3–H3K36me2/3 signal is only observed at regions with H3K9me3 and H3K36me2/3 signals confirming AND-readout. d Representative gene ontology (GO) analysis of biological processes linked with cluster 4 from WE-2 and cluster 7 from SE-2. For more information about all the other clusters, refer to Additional file 1: Tables S2 and S3
