Fig. 8.

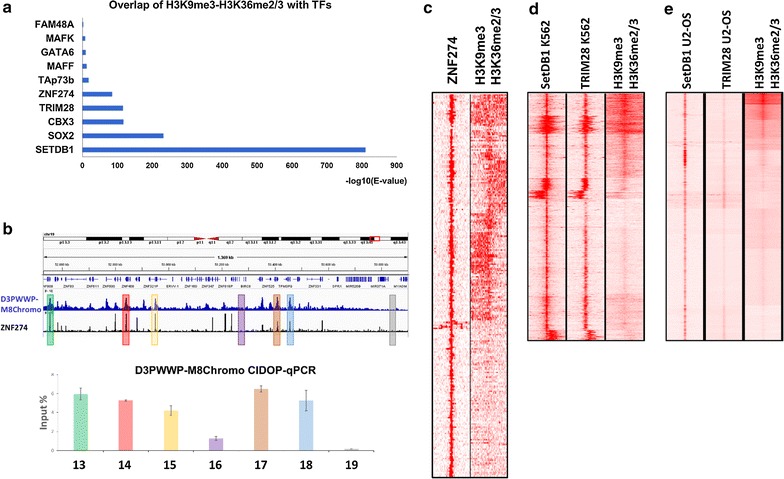
Association of the H3K9me3–H3K36me2/3 bivalent state with the zinc finger–Trim28–SetDB1 pathway. a Overlap of H3K9me3–H3K36me2/3 with peaks of DNA-binding factors from the Re-Map database. b Genome browser view of a part of chromosome 19 with many zinc finger (ZNF) genes showing co-localization of ZNF274 signal and H3K9me3–H3K36me2/3. D3PWWP-M8Chromo CIDOP-seq data were confirmed by CIDOP-qPCR using 5 H3K9me3–H3K36me2/3 peak and 2 control regions (Additional file 1: Table S5). The error bars show SEM values based on two independent biological repeats. c Clustering analysis of tag densities of H3K9me3–H3K36me2/3 and ZNF274. Tags were collected in 20-kb window (− 10 to + 10 kb) centered on the midpoints ZNF274 peaks and sorted by k-means clustering (ten clusters). d Clustering analysis of tag densities of SetDB1 and TRIM28 from K652 cells with H3K9me3–H3K36me2/3 from HepG2 cells. Tags were collected in 10-kb windows (− 5 to + 5 kb) centered on the midpoints SetDB1 peaks and sorted by k-means clustering (ten clusters). e Clustering analysis of tag densities of SetDB1 and TRIM28 from U2-OS cells with H3K9me3–H3K36me2/3 from HepG2 cells. Tags were collected in 10-kb windows (− 5 to + 5 kb) centered on the midpoints SetDB1 peaks and sorted by k-means clustering (ten clusters)
