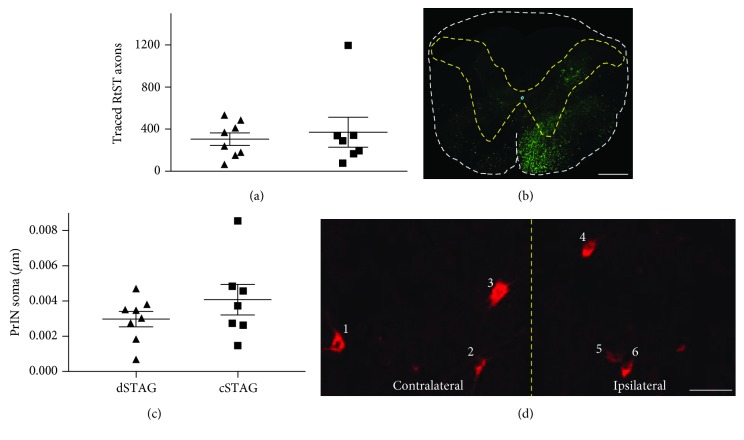
Figure 4.
RtST-traced axon and PrIN counts. No significant difference in the number of traced axons was found between groups (a). Representative C1 cross-section showing the BDA-traced RtST (green; (b)). White dashed line, outline of cross-section. Yellow dashed line, outline of grey matter. Scale bar = 500 μm (b). No significant differences in the number of soma in the grey matter were found between dSTAG and cSTAG groups (c). Six PrIN cell bodies in the bilateral grey matter (d). Yellow dashed line, midline. Scale bar = 50 μm (d). Error bars represent the SEM. Contralateral and ipsilateral are relative to the T10 SCI.

