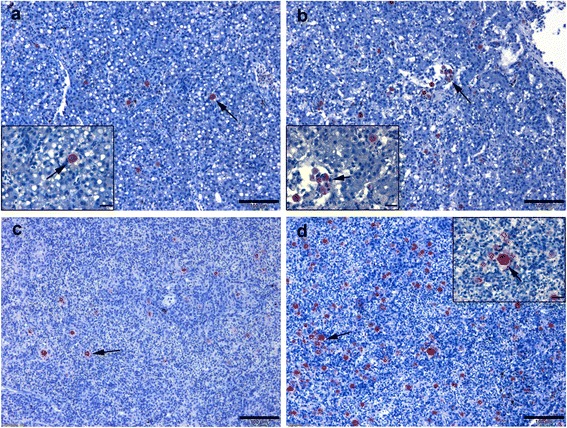
Fig. 8.

Comparative immunohistochemistry of PKD on rainbow trout liver and spleen during single and co-infection with WD. a Liver section of single Tb infected group, 90 dpe showing presence of few parasite stages in hepatic parenchyma (arrow). b Liver section of Mc-then Tb co-infected group, 120 dp initial exposure to Mc (90 dpe to secondary Tb) showing presence of many parasite stages in hepatic parenchyma and central veins (arrow). c Spleen section of single Tb infected group, 90 dpe showing presence of few parasite stages (arrow). d Spleen section of Mc-then Tb co-infected group, 120 dp initial exposure to Mc (90 dpe to secondary Tb) shows presence of many parasite stages in the parenchyma (arrow) associated with horseshoe-shaped multinucleated giant cell, strong positively IHC stained (inset, arrow). Scale-bars: a, 100 μm (inset 20 μm); b, 100 μm (inset 20 μm); c, 100 μm; d, 100 μm (inset 20 μm)
