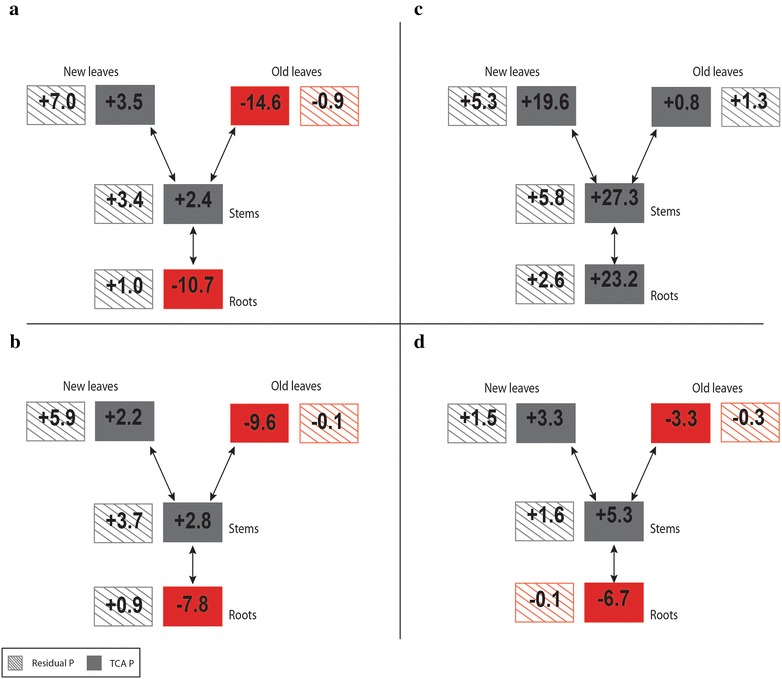
Fig. 3.

Net gains and losses of P in mg P in the different compartments of the − P (a, b) and + P (c, d) plants, for the labelling period (15–23 DAS; b, d) and the days after the labelling period (23–33 DAS; a, c). For clarity reasons, standard deviations are not shown. Red indicates net P losses; grey indicates net P gains
