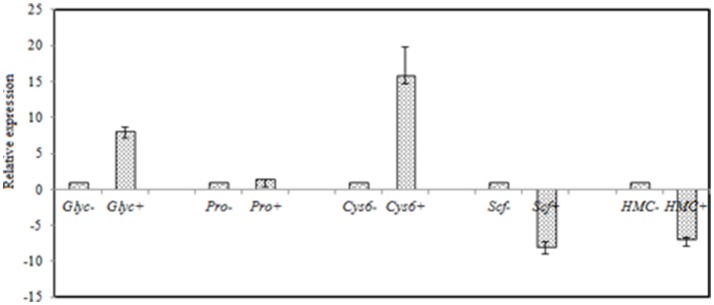
Figure 7.
RT-qPCR validation of selected genes with significant differential expression in the control and the salt-treated samples. RT-qPCR data are mean ± SD from three biological replicates. “−,” and “+” indicates A. montevidensis was induced without, and with 3 M NaCl. DEGs putatively encoded glycerol-3-phosphate dehydrogenase (Glyc), proline oxidase (Pro), Zn(II)2Cys6 transcription factor (Cys6), SCF ubiquitin ligase (Scf), and hydroxymethylglutaryl-CoA (HMG-CoA) synthase (HMC).

