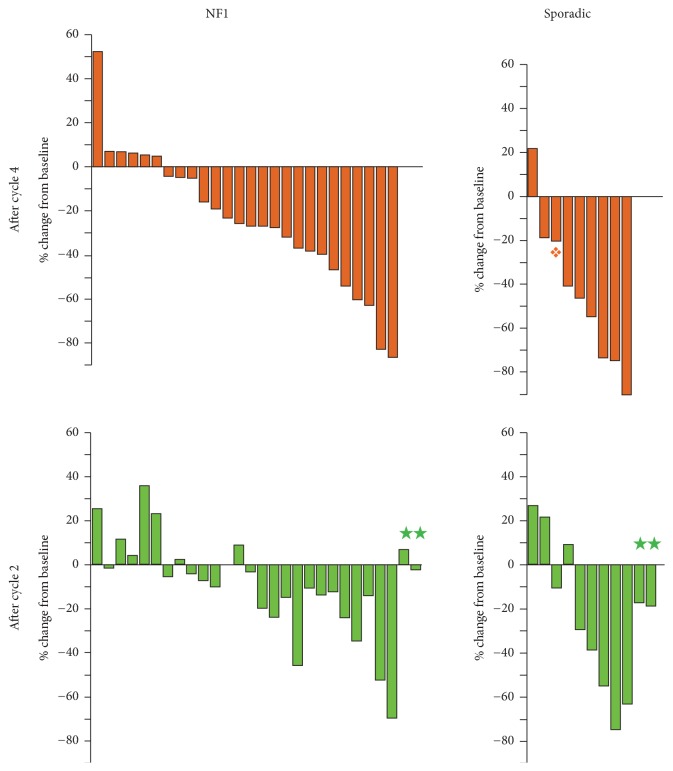
Figure 2.
Waterfall plots showing change in 2-dimensional tumor measurements according to WHO criteria after 4 cycles (2 cycles ifosfamide and doxorubicin, IA, and 2 cycles of ifosfamide and etoposide, IE, upper panels) and 2 cycles (IA, lower panels). On all four panels patients are arranged by best response measured after cycle 4. ★Patients removed from treatment after cycle 2. ❖Target lesion stable, but progressive disease with new lesion.

