Figure 1.
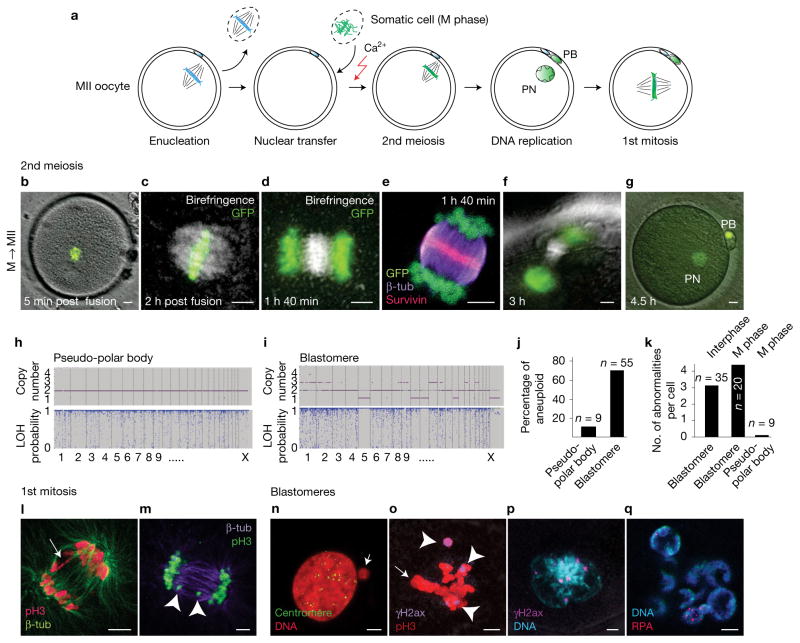
Genomic instability after human somatic NT. (a) Schematic representation of human NT. Mitotic H2B-GFP-expressing fibroblast genomes were transferred into enucleated MII human oocytes. PB, polar body; PN, pronucleus. (b,c) H2B-GFP fibroblast genome at 5 min (b) and 2 h (c) after NT into MII human oocytes (post fusion). (d–g) Chromosome segregation after oocyte activation using calcium ionophore and puromycin. (h,i) Representative samples of single-nucleotide polymorphism array analysis of copy number and heterozygosity in polar body (h) and NT blastomeres (i). LOH, loss of heterozygosity. (j) Percentage of karyotypically abnormal pseudo-polar bodies (n = 9) and blastomeres (n=55). (k) Average number of abnormalities per blastomere in NT embryos (interphase blastomere, n = 35; M-phase blastomere, n = 20; pseudo-polar body, n = 9). Top label indicates the cell cycle of the transferred genome. (l–q) Immunostaining for DNA damage and genomic instability. (l) Bridge formation at the first anaphase (arrow). (m) Chromosome fragments (arrowheads) at the first anaphase. (n) Centromere-negative micronucleus (arrow) in a blastomere. (o) Immunostaining for γH2AX (arrowheads) indicating DNA damage at mitosis in blastomeres of NT embryos and failure of integration of all chromosomes on metaphase plate (arrow). (p) γH2AX foci at interphase. (q) Multinucleation and replication protein A (RPA) foci in interphase blastomere. Scale bars, 5 μm.

