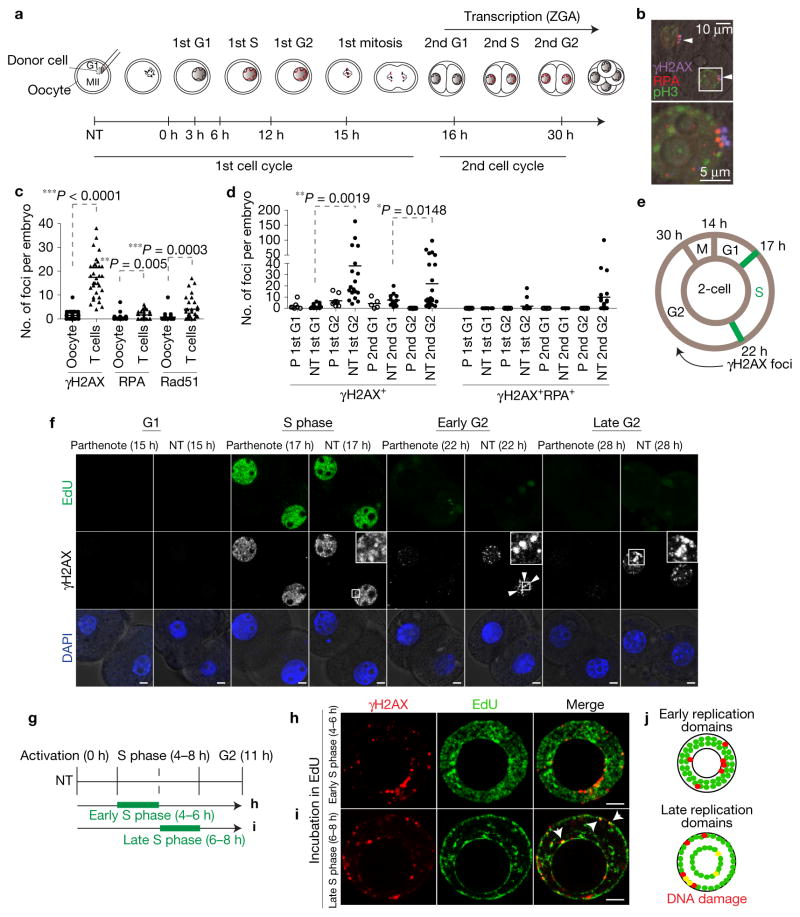
Figure 5.
DNA damage following progression through DNA replication in the second cell cycle. (a) Schematic representation of the first and second cell cycle after NT. ZGA, zygotic genome activation. (b) DNA damage in interphase nuclei of a NT embryo (G2 of the second cell cycle). The arrowheads point to γH2AX + RPA + DNA damage foci. The two channels are shifted for visibility. Scale bars, 10 μm (top panel), 5 μm (bottom panel). (c) Quantification of DNA damage foci at G2 of the second cell cycle (28 h postactivation) in embryos reconstituted with oocyte nuclei versus somatic nuclei. The lines represent the mean number of foci in n=31 (oocytes as nuclear donor) and n=33 (T cells) embryos. (d) Quantification of γH2AX+ and γH2AX+ RPA+ foci in parthenotes and NT embryos at the indicated time points. The lines represent the mean number of foci in n=7 (P, 1st G1), 25 (NT, 1st G1), 9 (P, 1st G2), 30 (NT, 1st G2), 5 (P, 2nd G1), 13 (NT, 2nd G1), 23 (P, 2nd G2), 24 (NT, 2nd G2) embryos. *P < 0.05; **P < 0.01; ***P < 0.005 (Student’s t-test). (e) Schematic of cell cycle progression and appearance of DNA damage in NT embryos in the second cell cycle. Hours after activation are indicated. (f) Representative images of DNA damage (γH2AX foci, arrowheads) at the indicated time points. Experiments were repeated 3 times for γH2AX and DAPI and once for EdU. Multiple representative images of different embryos were captured per experiment, except for the parthenotes 15 h time point, for which just one image was captured. NT embryos were reconstituted using T cells. (g) Schematic representation of EdU labelling at early or late S phase in the first cell cycle after NT, followed by fixing and immunostaining in G2. (h,i) Staining for EdU and γH2AX, a marker of DNA damage, after incubation with EdU at early (h), or late (i) S phase. Nuclei from cumulus cells were transferred into enucleated MII oocyte. Arrowheads point to DNA damage in late replicating regions. (j) Schematic representation of early and late replicating regions. Co-localization of DNA damage with the replication domain is marked by yellow dots. Scale bars, 5 μm.

