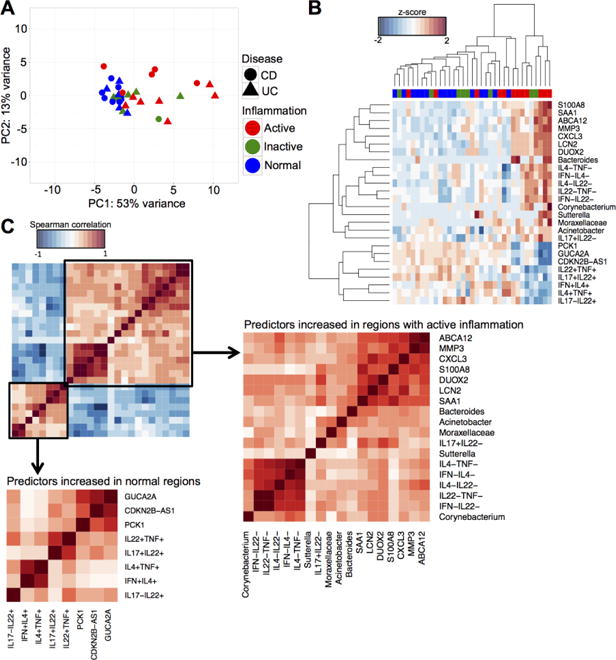
Figure 1.

Integrated analysis from N=35 biopsies reveals a set of inflammation-specific features from the FACS, 16S microbial and microarray data, regardless of disease type. (A) PCA of the 26 predictors of inflammatory states. (B) Bi-clustering results of the 26 inflammation predictors visualized as heatmap. Rows are predictors and columns are samples. Red = Active, green = Inactive, blue = Normal. (C) Correlation matrices of predictors of inflammatory states using the Spearman correlation metric. Subsets of predictors were identified that were increased in regions with active inflammation and in normal regions, respectively. Predictors from these two different subsets were highly correlated within subset and inversely correlated between subsets.
