
Figure 1. Systematic pharmacologic characterization of hemin-induced cell death in primary cortical neurons. Cell death is inhibited by chemical inhibitors of ferroptosis or necroptosis.
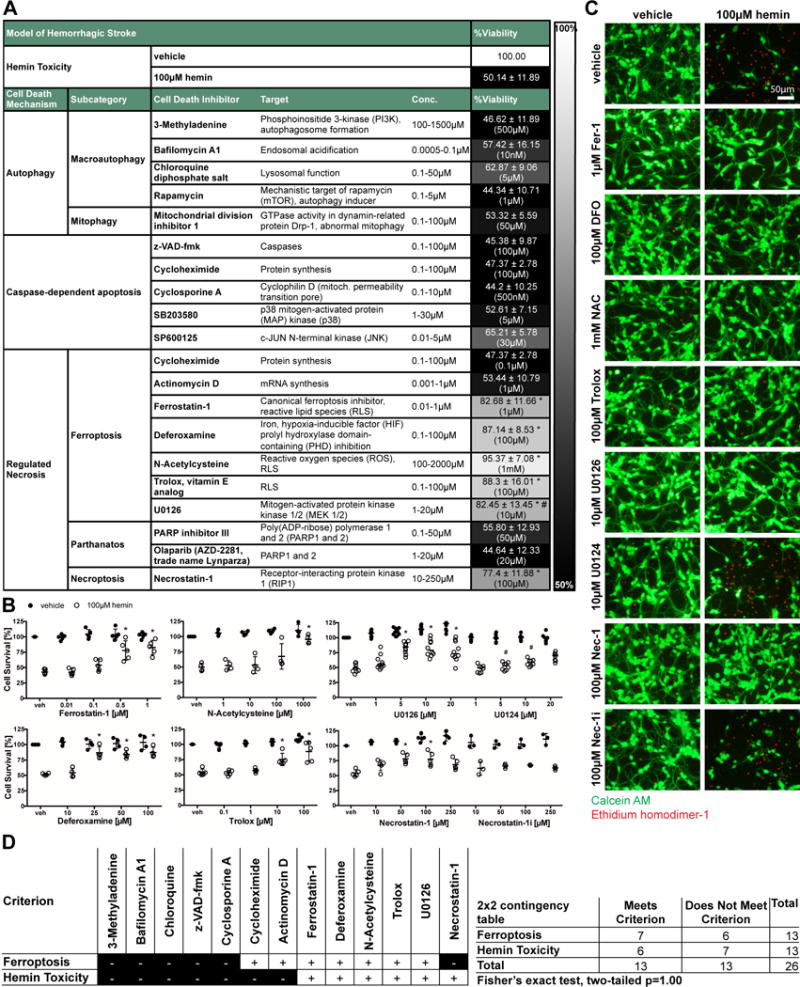
(A) Primary neurons treated with 100μM hemin (LD50) and chemical inhibitors effective in distinct cell death models (e.g. apoptosis, autophagy, ferroptosis) were examined. Values show mean ± SD at representative concentration in brackets. Grayscale coding indicates the continuum from no protection in the presence of hemin (black) to maximal cell viability (white). (B) Concentration-responses of inhibitors that inhibit hemin-induced death. Values represent mean ± SD, except for U0126 where medians are given. * p<0.05 versus hemin, # p<0.05 versus U0124. (C) Representative live/dead staining are shown. Scale bar = 50μm. (D) Statistical analysis of profile of chemical inhibitors between operationally defined ferroptosis20, 27 and hemin-induced toxicity revealed that hemin toxicity in primary neurons can be considered ferroptotic.