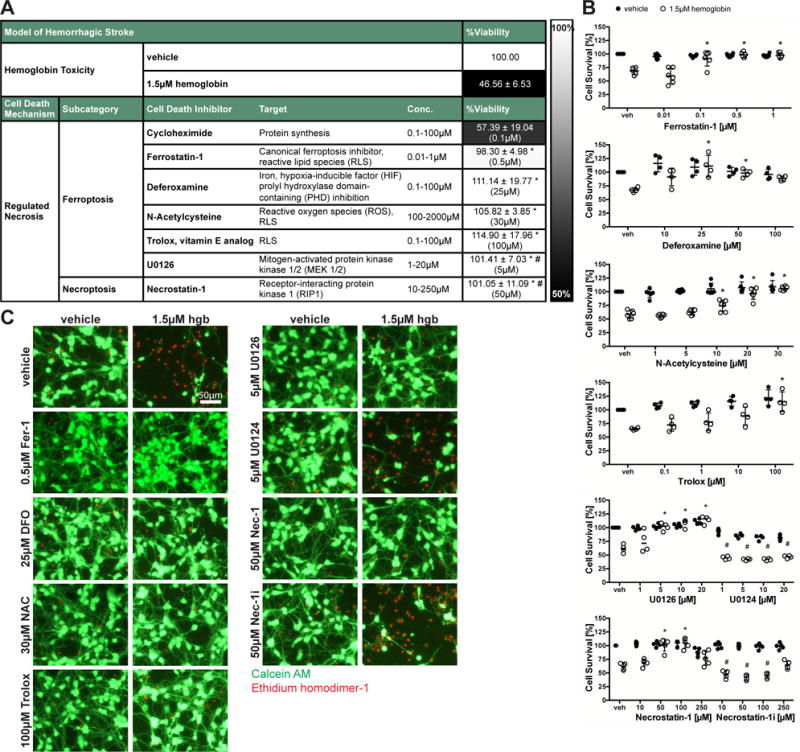
Figure 2. Inhibitors capable of preventing hemin-induced death also inhibit hemoglobin-induced-cell death.

(A) Primary neurons were exposed to 1.5μM hemoglobin (LD50) and ferroptotic and necroptotic inhibitors. Values reflect mean ± SD at representative concentration in brackets. Grayscale coding reflects a continuum from no protection from hemoglobin toxicity by a designated chemical inhibitor (black) to maximal possible cell viability (white). (B) Concentrations-responses of protective inhibitors in hemoglobin toxicity. Values represent mean ± SD, except for U0126 where medians are given. * p<0.05 versus hemoglobin, # p< 0.05 versus inactive analogs U0124 or Necrostatin-1i. (C) Representative live/dead staining are shown. Scale bar = 50μm.
