
Figure 3. Hemorrhagic stroke in vitro and in vivo shows molecular features of ferroptosis or necroptosis.
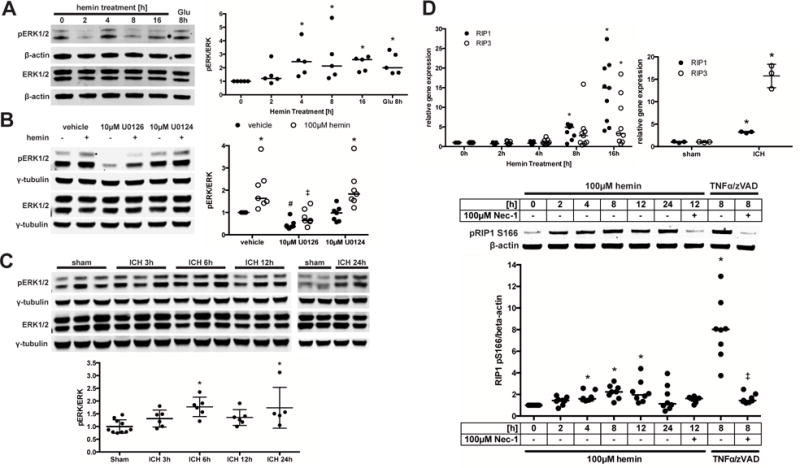
(A) Total and phospho-ERK1/2 protein levels were assessed in primary neurons exposed to hemin or Glutamate (positive control for oxidative stress-induced ERK phosphorylation). Values represent medians of ratios of phospho- by total ERK1/2 normalized to β-actin loading control that does not change in response to death stimuli. * p<0.05 versus 0 hours. (B) Primary neurons were exposed to hemin and U0126 or its inactive analog U0124 for 8 hours. Total and phospho-ERK1/2 protein levels were normalized to γ-tubulin. Values represent medians. * p<0.05 versus without hemin, # p<0.05 versus vehicle without hemin, ‡ p<0.05 versus vehicle or U0124 with hemin. (C) Total and phospho-ERK1/2 expression is shown in striatum of mice following ICH. Values represent mean±SD of ratios of phospho- by total ERK1/2 normalized to γ-tubulin. * p<0.05 versus sham. (D) RIP1 and RIP3 mRNA expression was measured in primary neurons exposed to hemin or in striatum of mice following 24 hours of ICH. Values represent medians for hemin and mean±SD for ICH. * p<0.05 versus 0 hours or sham. Levels of phospho-RIP1 (normalized to β-actin) were measured in HT22 cells exposed to hemin or 100ng/ml TNFα + 5μM z-VAD-fmk for 8 hours (positive control). Necrostatin-1 served as confirmation for specificity of RIP1 kinase activity. Values represent median. * p<0.05 versus 0 hours hemin, ‡ p<0.05 versus 8h TNFα/zVAD.