
Figure 4. Hemin-induced death in cortical neurons shows ultrastructural features of necrosis/necroptosis.
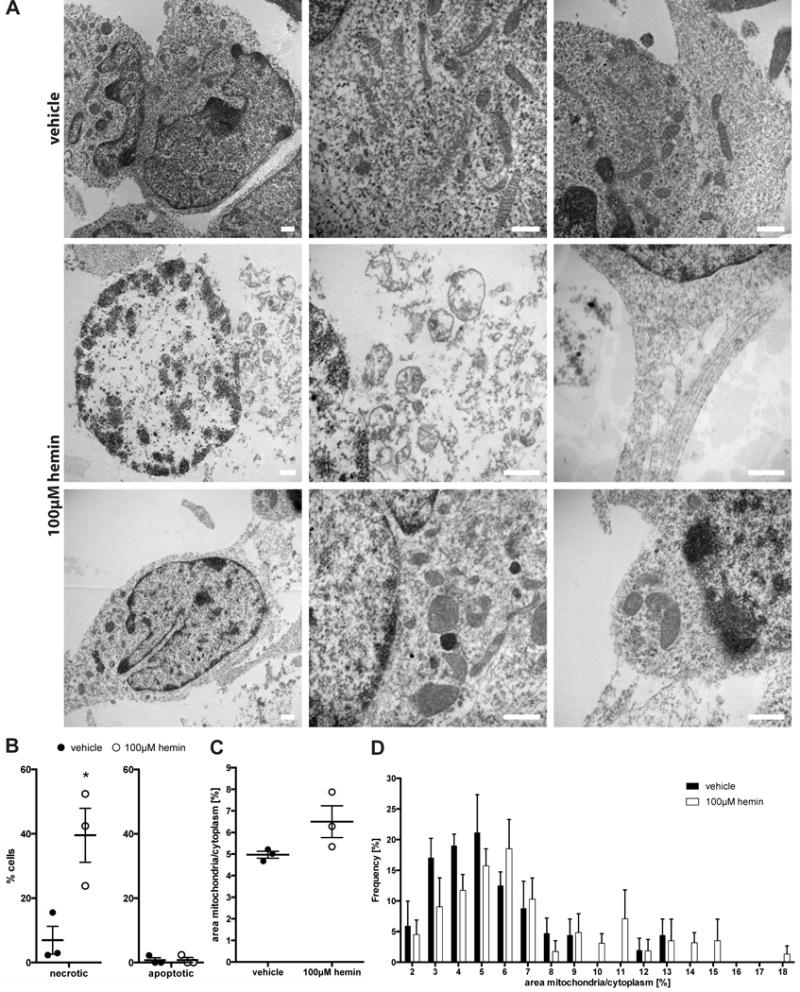
(A) Electron microscopic images of vehicle- (upper row) or hemin-treated cells (for 16 hours, middle and lower row). Some of the hemin-treated cells presented a necrotic phenotype with loss of plasma membrane integrity and disintegration of organelles (middle row, left and middle picture). Other hemin-treated cells displayed intact plasma membranes, but larger mitochondria (lower row, left and middle picture). Neuronal processes were no longer intact (middle and lower row, right pictures). Scale bars = 500 nm. (B) Hemin treatment increased the number of necrotic cells in culture. Note: we did not detect any apoptotic bodies in hemin-treated cells. Values represent mean ± S.E.M. (as this is the convention in the electron microscopy field). * p<0.05 versus vehicle. (C) Hemin treatment increased the mean percentage area of cytoplasm covered by mitochondria (left). Similarly, the frequency of appearance of larger mitochondria increased while the frequency of smaller mitochondria decreased (right). Values represent mean ± S.E.M.