
Figure 5. Ferroptosis is not upstream of necroptotic death signaling following hemin toxicity.
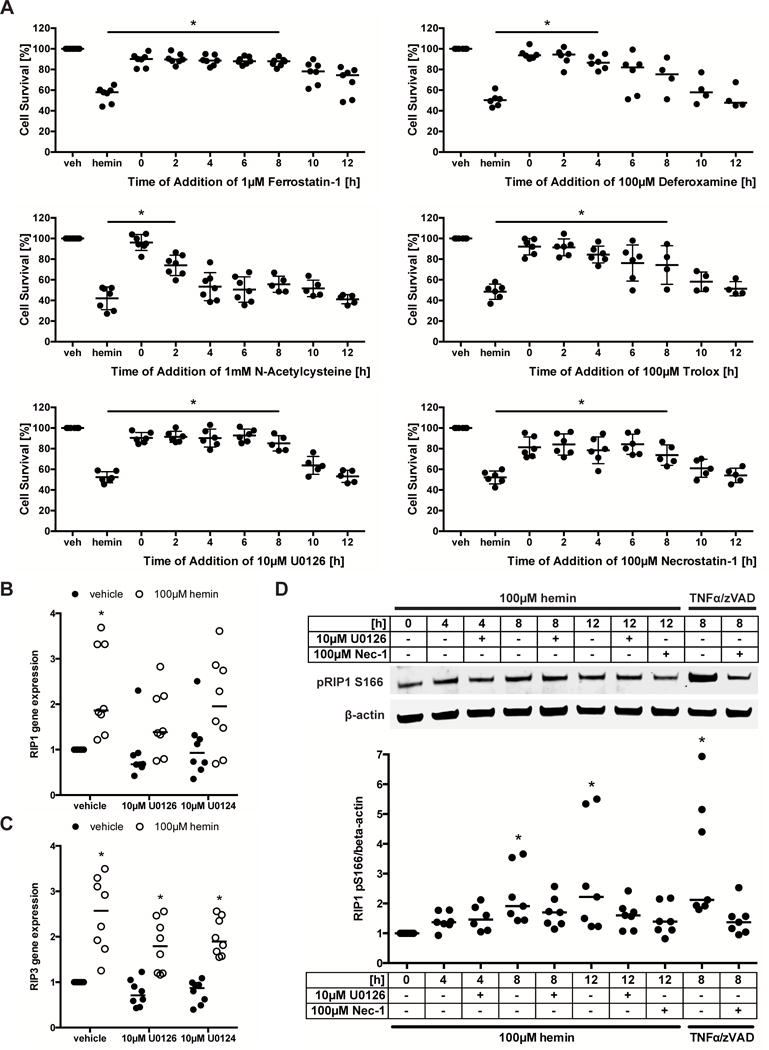
(A) Therapeutic window of protective ferroptosis and necroptosis inhibitors are shown. Primary neurons were treated with chemical inhibitors starting every 2 hours between 0 and 12 hours following hemin treatment and cell viability assessed at 16 hours. Values represent mean ± SD, except for Deferoxamine where medians are given. * p<0.05 versus hemin. (B) RIP1 and (C) RIP3 mRNA expression was measured in primary neurons exposed to hemin and U0126 or its inactive analog U0124 for 8 hours. Values represent medians. * p<0.05 versus vehicle without hemin. (D) Levels of phospho-RIP1 (normalized to β-actin) were measured in HT22 cells exposed to hemin and U0126 or 100ng/ml TNFα + 5μM z-VAD-fmk for 8 hours (positive control). Necrostatin-1 served as confirmation for specificity of RIP1 kinase activity. Values represent median. * p<0.05 versus 0 hours.