
Figure 6.
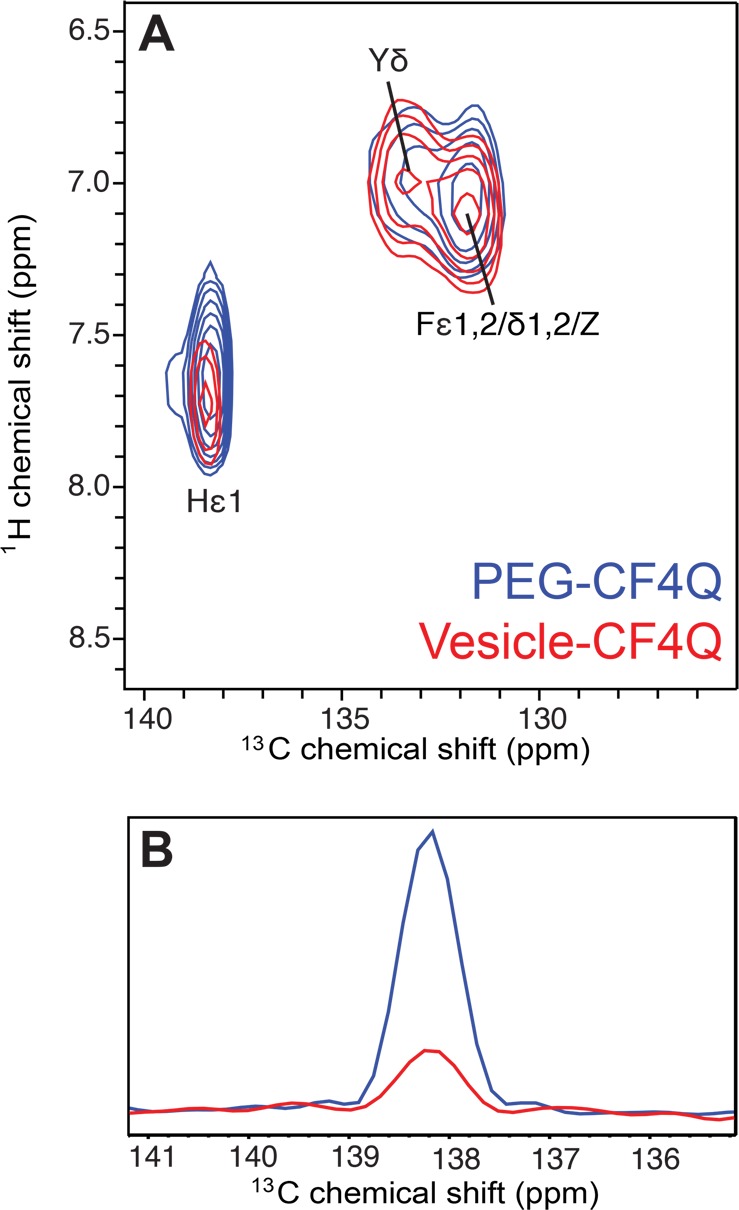
Comparison of 1H–13C INEPT spectra of U–13C,15N-CF4Q in PEG-mediated (blue) and vesicle-mediated (red) functional arrays with CheA and CheW. Spectra are each scaled to a peak volume of 1 for the single Tyr Cδ resonance. (A) Expansion of the aromatic region of the spectrum illustrates the similarity of the Phe resonances for both arrays, and the greater intensity of the His Cε1 resonance for the PEG array. (B) Comparison of one-dimensional slices for His Cε1 shows 4-fold larger peak intensity in the PEG array, which is consistent with limited mobility of the His-tag region. The PEG sample spectrum was collected with 11.11 kHz MAS, ∼ 10 °C sample temperature, and a 1 s recycle delay (64 slices of 1200 scans/slice for a total experiment time of 22 h), on a sample containing 120 nmol CF (plus PEG, CheA, and CheW). Vesicle sample spectrum collected as in Figure 3.